We are pleased to announce today that we have updated National Land Cover Database (NLCD) 2016 data available for use with our latest Terrain Analysis Package (TAP™) 7.2 software. This is an update to the NLCD 2011 data that we have been offering since 2014. NLCD 2016 was just released by the USGS in May 2019. The TAP Land Use module is required in order to utilize land cover data, such as NLCD 2016, in TAP Path and Coverage studies.
nlcd data description
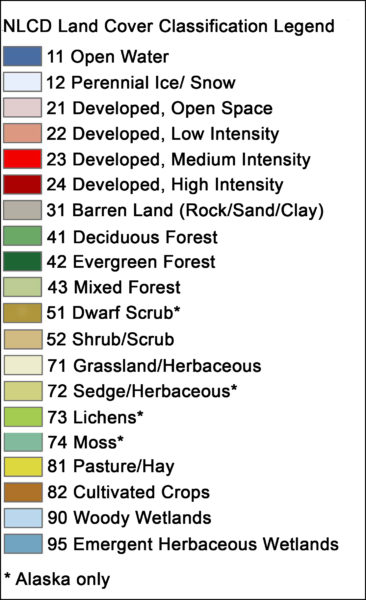
Land Cover or Land Use data describes the artificial or naturally-occurring land features at a particular location, assigning one of a discrete set of classifications to each point. Within the U.S., SoftWright has provided NLCD data since 2012, starting with NLCD 2006 then NLCD 2011 and now the just-released NLCD 2016. For areas outside of the U.S., SoftWright provides land cover data from the Moderate Resolution Imaging Spectroradiometer (MODIS). These land cover data sets categorize land use attributes, such as Urban, Agricultural, Forest, etc. The NLCD legend is shown below.
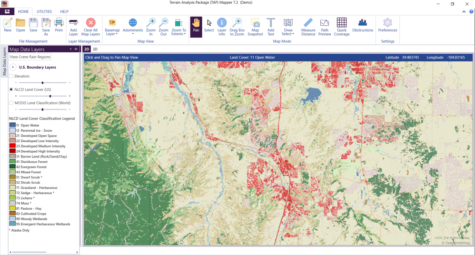
The latest NLCD 2016 and MODIS v6 data are available as data layer overlays in TAP Mapper. Showing these layers in TAP Mapper is an easy way to view the land cover data for your area of interest. Simply click on the data layers pane and select the layer that you would like to view. Move the mouse cursor over the map and the land cover classification under the mouse cursor is displayed in the map information bar.
how and why to use land cover data in tap
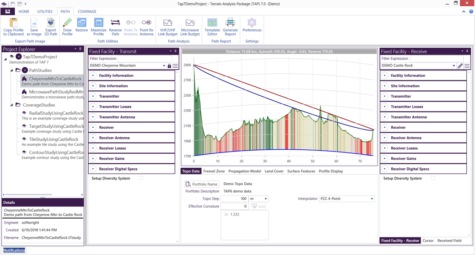
When the files are partitioned and named according to the required naming convention, TAP can determine the land cover classification at a given set of coordinates. As shown below, the land cover category can be shown graphically along a path study. This can aid in the consideration of where trees or buildings may impact link performance and inform the placement of appropriate surface features. It can also help identify where possible reflection points along the path may be especially problematic due to the presence of water.
Pricing remains the same for NLCD 2016 as it was previously for NLCD 2011. For more information on adding the TAP Land Use module or acquiring the NLCD 2016 data for your area of interest, please contact Curt Alway at (800) 728-4033×1 or email sales@softwright.com.