HDSpectrum™ Intermodulation Tutorial
HDSpectrum is the TAP6 user interface for intermodulation studies. This tutorial will step through the basic operations of HDSpectrum. Note there are other articles that contain extensive and detailed information about HDSpectrum and intermodulation studies. Many of these are referenced and linked below. In order to gain a good understanding of the ways HDSpectrum can be of the most use in your intermodulation studies, you should also read these other articles.
(Note that all values and settings in this article are for illustration purposes only. You should determine the appropriate settings for your application using good engineering judgment.)
In this tutorial, you will compute intermodulation products as a function of transmit and receive frequencies, transmitter harmonics, protected receiver frequencies and other study parameters that you will specify. You will begin by creating a new intermod database file used to store information about the transmit and receive facilities analyzed by this program. After defining several new transmit and receive frequencies, you will configure the intermod study scope parameters and experiment with several methods you may wish to use in order to filter out intermod products that you consider less likely to occur. When you execute your intermod study, TAP will calculate and compare resultant intermod products to receive frequencies for those transmit and receive facilities you have opted to use.
If a resultant product falls within a protected frequency (receive frequency +/- receiver offset), the intermod product is written to both a text file report and an intermod results file. The report is a simple ASCII text file you can view, edit and print with any text editor or word processor. The intermod results file is a database that can be further studied with HDSpectrum. HDSpectrum includes a Report Filter function that allows you to apply one or more filter conditions on the intermod resultants generated in this intermod study program. This filtering enables you to generate a report consisting of a subset of the original set of intermod products.
You are advised to consult the section on Finding, Solving, and Preventing Intermodulation Problems for more detailed technical information related to the diagnosis of existing intermod problems and the interpretation of the TAP intermod results.
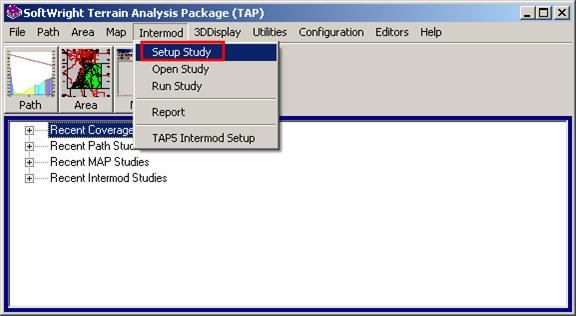
From the main menu of TAP6, use your left mouse button to click on the Intermod menu, then on the Study option to display the TAP Open File dialog box pictured below.
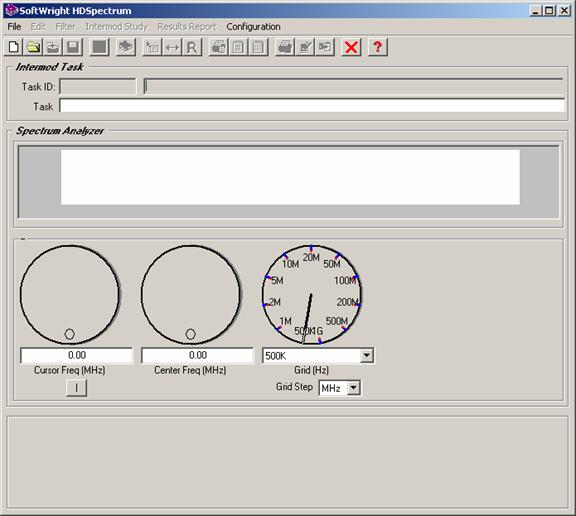
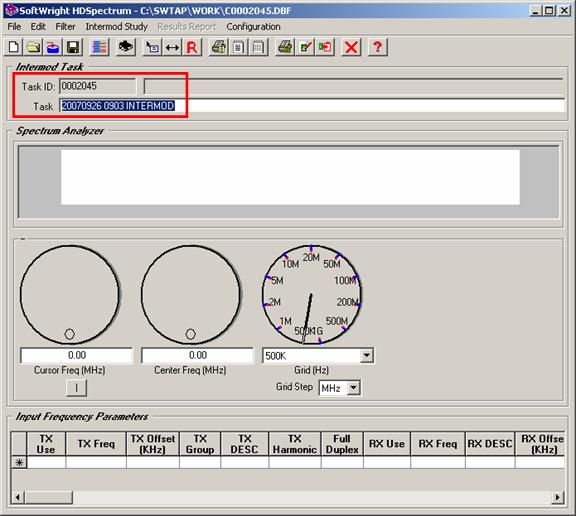
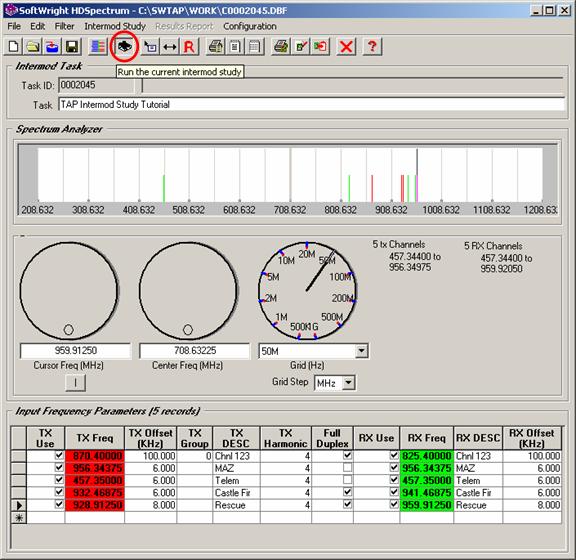
The HDSpectrum form will be displayed:
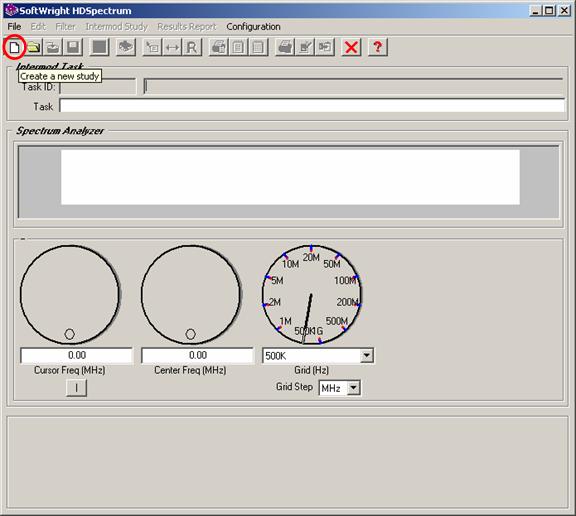
First we will create a new Intermod study. Click the New button at the left end of the toolbar at the top of the form.
Other articles describe how to open an existing study or a study created with an earlier version of the TAP Intermod software.
The program will create a new database for the study. This may take several seconds:
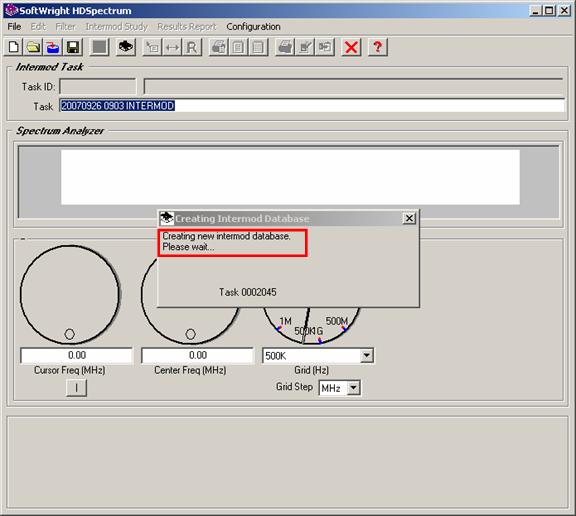
A new Task ID will be assigned by the program and a default Task Description will be assigned:
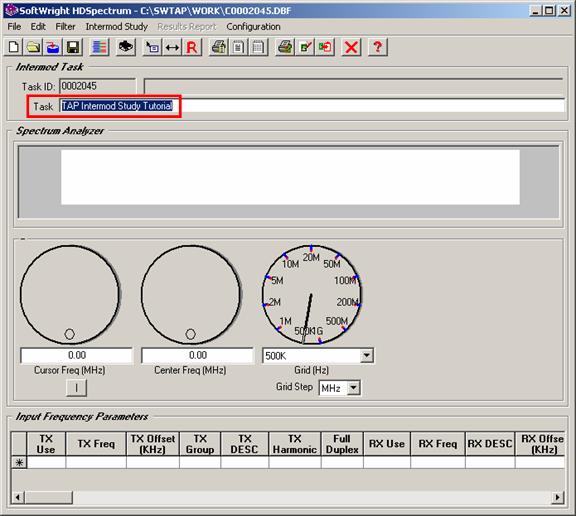
You can change the Task Description to include information that will be useful to you in identifying a study in the future, such as “TAP Intermod Study Tutorial”:
Now we are ready to enter transmit and receive data information that is required for an intermod study.
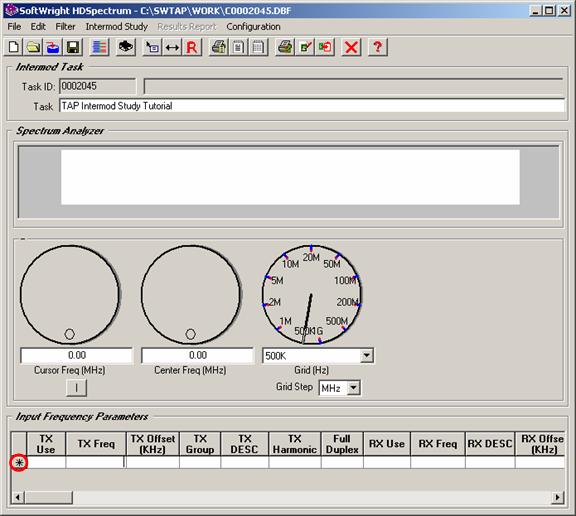
The Transmit and Receive frequency information is located in the Input Frequency Parameters section near the bottom of the form. Because this is a new Task, the database is empty.
To create a new Intermod frequency record, place the mouse cursor in the row marked with an asterisk ("*") at the left end of the row. This row is always at the bottom of the list.
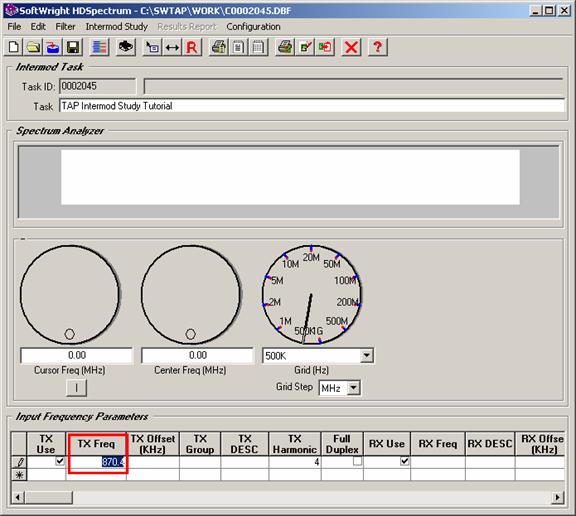
Place the mouse cursor in the “TX Freq (MHz)” column and left-click the mouse to place the text cursor in that column.
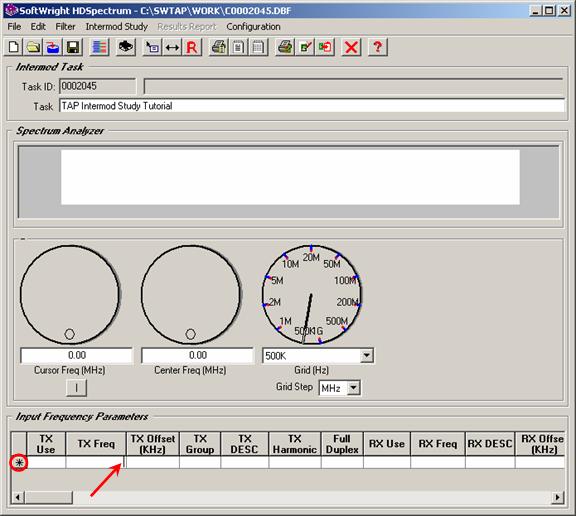
This
column is the transmitter carrier frequency in megahertz (MHz). When you start
typing on the "*" row, a new record is automatically created. Enter
a transmitter frequency value of
870.4
As you edit a row in the Input Frequency Parameters grid, notice the small pencil icon at the left end of the row.
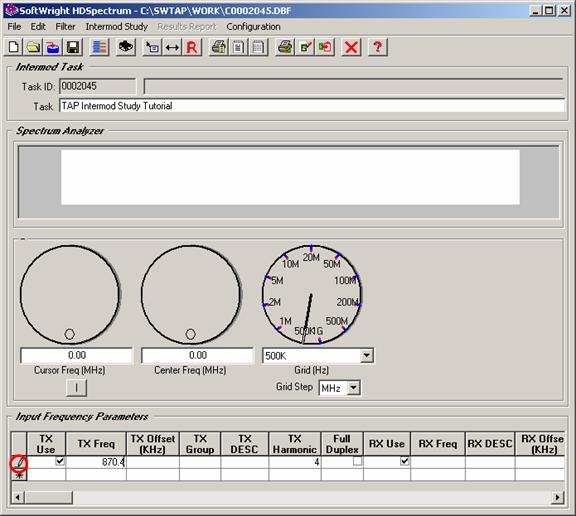
This pencil icon indicates that the row is being edited. The values you enter or change are not written to the database until you move off of the row (such as up or down to another row) and the pencil icon disappears. If you want to abandon changes to a record, press the Esc key on the keyboard and the record will revert to the previous values, and the pencil icon will be removed.
The “TX Offset (KHz)”
column represents the modulated range (in kHz) above and below the transmitter carrier
frequency. For this example, enter the value of
100.
The “TX Group” column
provides an option to assign a
group number
to transmitter facilities. The group number is used to run the intermod study
using several possible frequencies, “grouped” together (described below). This
example will not use this function, so enter a value of
0 (the numeral zero, not the letter "O")
The “TX Desc” column
provides a description of the transmitter frequency. Enter a
description:
Chnl 123
The “TX Harmonics”
column enables you to select the number of harmonics to be computed for each
transmitter frequency. For this example, use the pull-down list to select a
value of
4
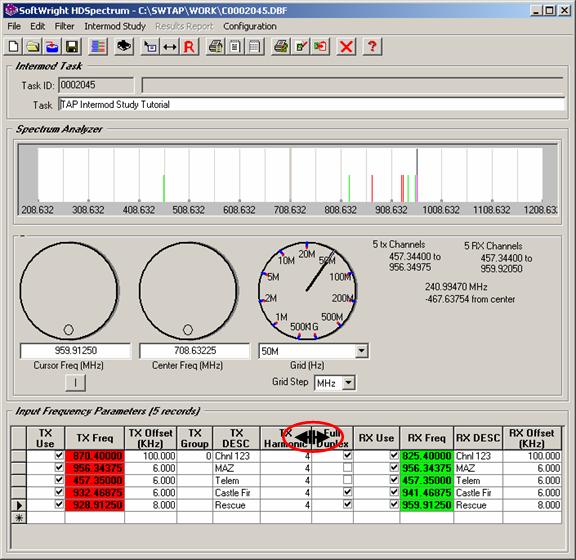
The “Full Duplex”
column marks a record as operating in full duplex mode, meaning that
the base station transmitter and receiver will be operating simultaneously.
Under these conditions, it is possible for that transmitter frequency to
combine with other transmitter frequencies located nearby to create an intermod product that
could interfere with its own receiver frequency. For this example,
click the
box to mark it.
The "RX Use" check box
and the "TX Use" check box are described below. For now,
click the
box to mark it.
The “RX Freq (MHz)” column
is the center frequency for the receiver in megahertz. For this example, enter
a value of
825.40
The “RX Desc” column
is a description of the receiver frequency. You can enter a different
description than the transmitter description for the same record. If you want
the same description, enter a space for the RX Desc value. When you leave the
RX Desc cell for the record, the TX Desc value will be inserted. For this
example, enter a
blank space.
The “RX Offset (kHz)”
column is the protected range above and below the receiver center frequency. For
this example, enter a value of
100.
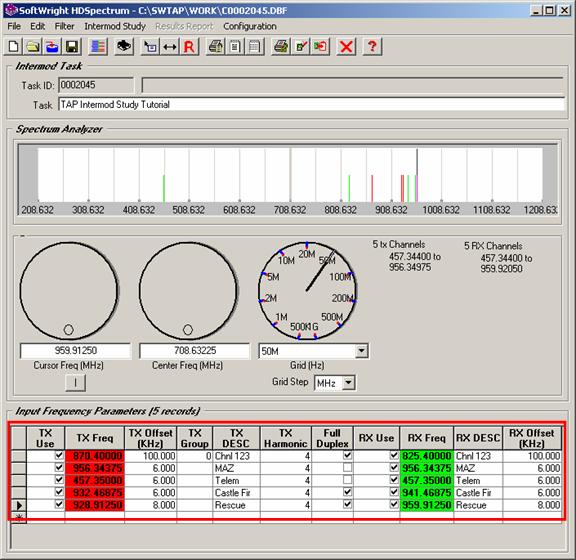
These values complete the information for the first frequency parameter record entered for this example:
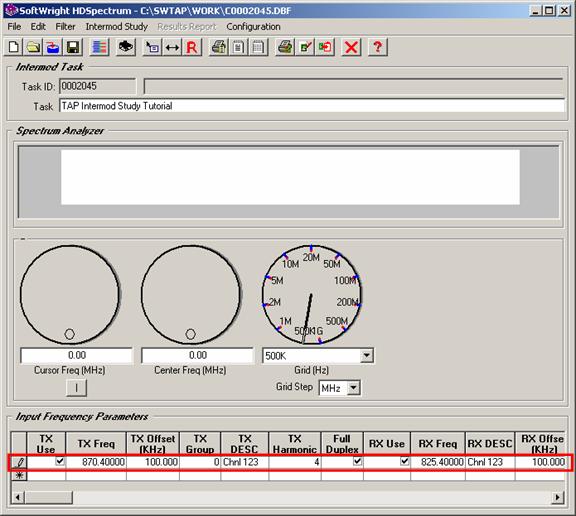
As long as you are editing the record (that is, you have not clicked off of the record) the pencil icon is still displayed at the left end of the record.
As soon as you move off of the record, the values are written to the database (indicated by the pencil icon disappearing), and the frequencies are used to scale and draw the graphic display:
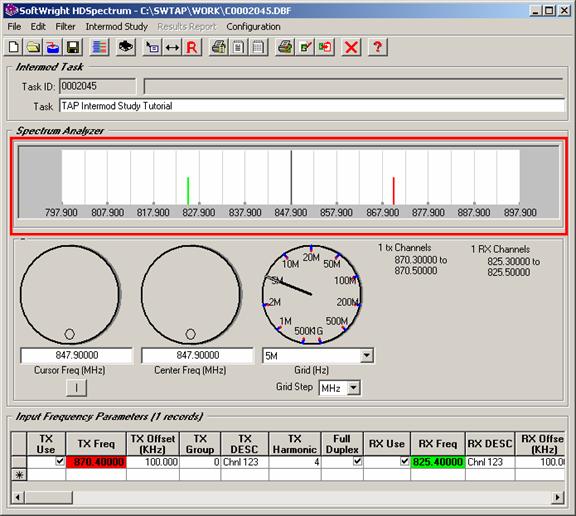
Transmit and receive frequencies values in the Input Frequency Parameters grid are highlighted (in red and green, respectively) when the frequencies fall in the range displayed by the graphic display of the spectrum. This will be demonstrated below when the graphic "Spectrum Analyzer" display is discussed.
To complete the database frequency parameter records for this example, enter the following additional records. (Remember, place the cursor on the bottom “*” row to add a new record):
|
TX Freq |
TX Offset |
TX Desc |
TX Harmonic |
Full Duplex |
RX Freq |
RX Desc |
RX Offset |
|
956.34375 |
6 |
MAZ |
4 |
No |
956.34375 |
MAZ |
6 |
|
457.35 |
6 |
Telem |
4 |
No |
457.35 |
Telem |
6 |
|
932.46875 |
6 |
Castle Fir |
4 |
Yes |
941.46875 |
Castle Fir |
6 |
|
928.9125 |
8 |
Rescue |
4 |
Yes |
959.9125 |
Rescue |
8 |
For each of these records, the "Use TX" and "Use
RX" boxes should be
checked.
You can leave the "TX Group" column
empty.
The "TX Group" function is only used if a non-zero value is entered in that column for one or more records. The zero value suggested above for the first record was entered as an illustration.
This results in a total of five Input Frequency Parameter records for this sample study:
Note that you can adjust the width of the columns as desired. Place the mouse cursor on the divider or “split” line on the column header.
The mouse cursor will change to show left and right arrows. You can drag the divider to change the column widths.
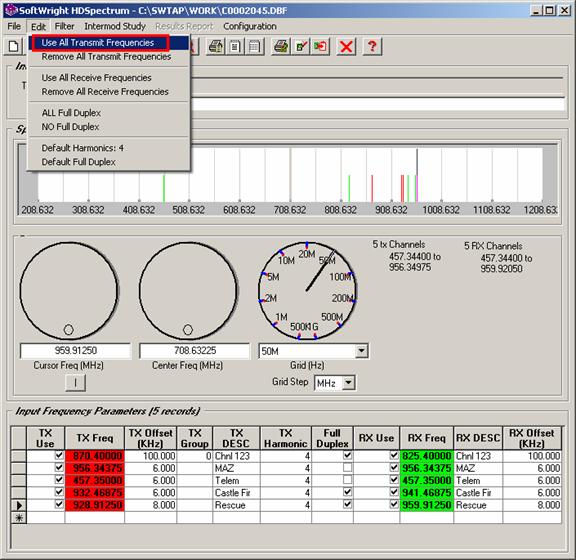
The “TX Use” and “RX Use” columns give you more flexibility in selecting frequencies from a data base you have created. You can elect to leave out frequencies (TX or RX or both) of a study without deleting the record from the database. If you click the box to uncheck it, the TX or RX frequency will not be included in the study. For this example, all the frequencies entered will be used, so each of the "TX Use" and "RX Use" boxes should be checked..
Note also the HDSpectrum “Edit” menu includes options to select or de-select all of the TX or RX Frequencies.
The columns (or database “fields”) used for setting up an intermod study are summarized below:
For each row, the columns represent the information for one facility, such as a transmitter, a receiver, or a combination of transmitter and receiver.
Now you can set other controlling parameters for the study. When you use TAP to study your actual or planned installations, you might have a need to manipulate the scope of your studies in order to isolate those intermod problems most likely to occur and reduce the program execution time.
In the Intermod Study menu, be sure the “Reference Freq Only?” option is not checked:
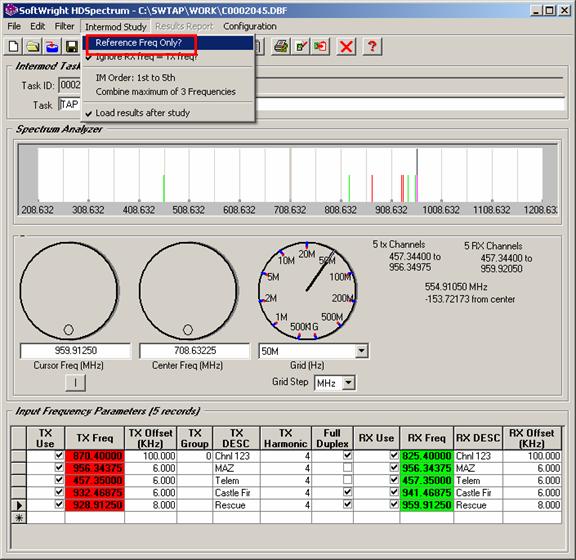
This option is used if you want to run the intermod study only considering user-selected “Reference” TX frequencies.
For example, suppose you have a site with no serious intermod problems with the currently operational transmitter frequencies. If a new transmitter frequency is proposed you might want to run an intermod study that only checks for possible intermod products resulting from the addition of the new frequency. You may not want to run the complete study to check all the existing frequencies (since no problems have been reported). If you add the new proposed frequency and mark the “Reference only” option, a new column ("TX Ref Freq" will be displayed.
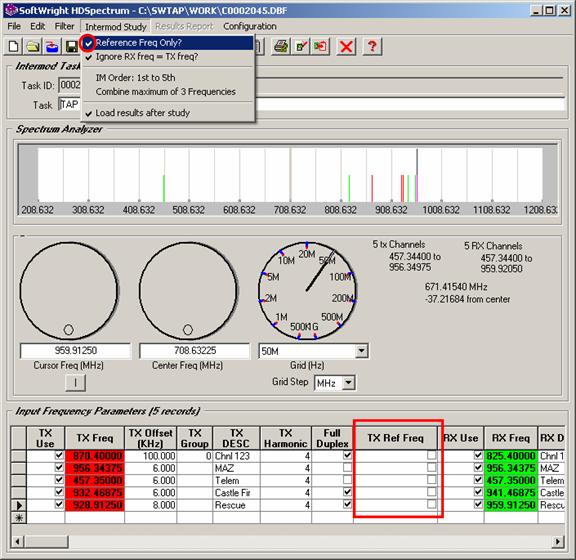
The new column will contain a checkbox for each TX frequency where you can mark certain transmitter frequencies as “reference” frequencies. Then the program will only check for and report intermod products that include any of the marked reference transmit frequencies.
Remember, for this sample study, the “Reference Freq Only” option should not be checked, and the “TX Ref Freq” column will not be displayed. (If you clicked the "Reference Frequency Only?" menu option and the "TX Ref Freq" column is displayed, click the menu item again to turn this option off.)
In the Intermod Study menu, be sure the “Ignore RX Freq = TX Freq?” option is checked.
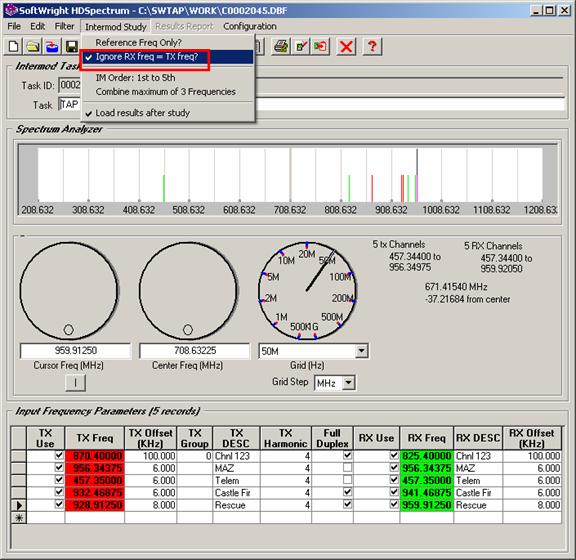
This option causes the program to ignore computed results from records with the transmit and receive frequencies having the same value. These represent simplex systems, where the transmit and receive function at the base station are used separately and never simultaneously. In a simplex system, the transmitter is never "on" when the receiver is in use. That means any computed intermod product that includes the transmitter frequency as a component of interference with its own receiver frequency is not of concern. This menu option forces the program to ignore any intermod products resulting from an interaction between those two frequencies. In this manner, you will avoid generating intermod "hits" for simplex equipment that use the same transmit and receive frequency, since that can never be the case with a simplex system.
In the Intermod Study menu, select the “IM Order” item to set the range of the product orders you want to report:
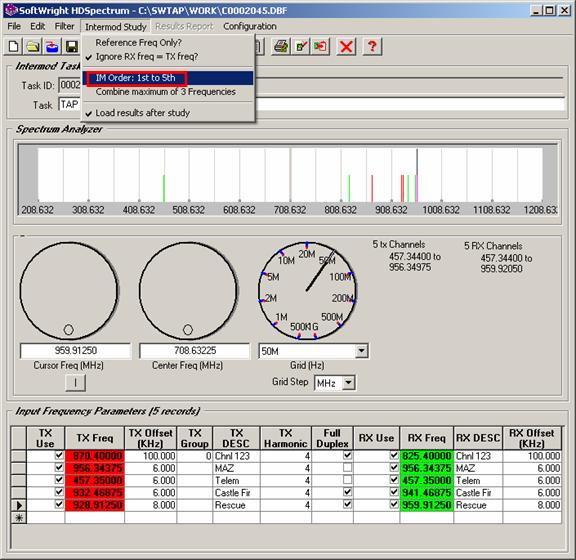
You will be prompted for the minimum and maximum values of the product orders to report.
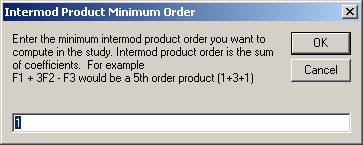
For this example, enter a minimum order
of
1
Click OK and the "Maximum Order" dialog box will be displayed:
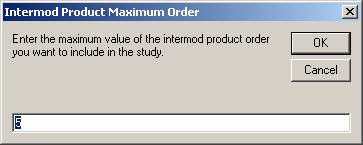
For this example, enter a maximum order of
5
Click OK to close the "Maximum Order" dialog.
The "order" of the product is the sum of the harmonic values for each of the transmit frequencies combined in the intermod product. For example, an intermod product generated from the second harmonic of transmitter frequency A and the fundamental frequencies of B and C (2*A + B + C) is a fourth order product (2 + 1 + 1). If you specified up to a 9th harmonic for four transmitters used in a particular study, a 36th order product is mathematically possible (9*A + 9*B + 9*C + 9*D). However, such a product is generally unlikely to be of practical significance. A typical intermod study will analyze products up to the 5th order. Product orders in excess of five are generally considered to be of less practical importance and will increase execution time.
In the Intermod Study menu select the “Combine maximum of x Frequencies” item to select the number of frequencies to combine in the study:
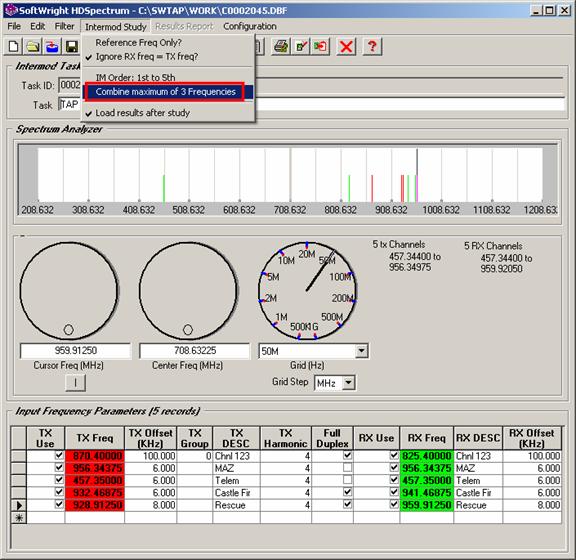
You will be prompted to enter the maximum number of frequencies.
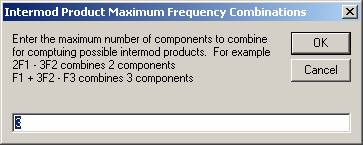
For this example, enter a maximum of
3
Click OK to close the "Maximum Frequency Combinations" dialog box.
You can direct TAP to combine up to four transmitter harmonics into a calculated intermod product. If you specify a Maximum Number of Frequency Combinations equal to 1, the harmonics of each transmitter will be examined one at a time. It is typically sufficient to study a maximum of three combinations. Four combinations may be calculated if desired but might result in computed intermod products considered too remote for practical purposes.
In the Intermod Study menu, be sure the “Load results after study” item is checked.
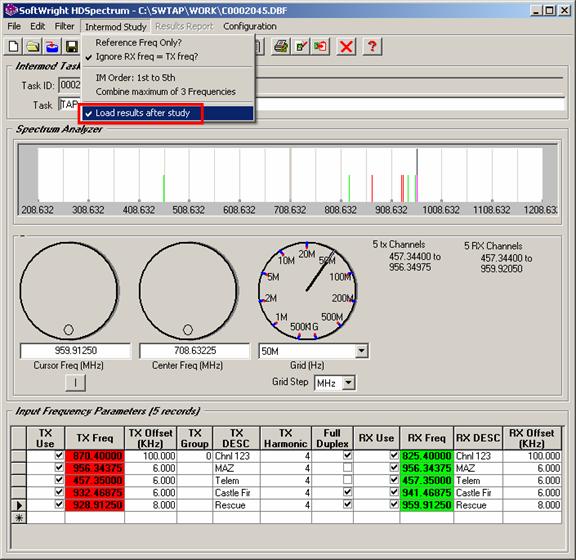
If this item is checked, the results will be loaded into HDSpectrum automatically after the study is run. If the item is not checked, you can load the results manually into HDSpectrum. The results can then be used to generate a number of reports to further refine the results for the most helpful analysis.
Click the Save button on the toolbar to save the study settings:

To start the execution of the intermod study, click the
Run button
![]() on
the toolbar:
on
the toolbar:
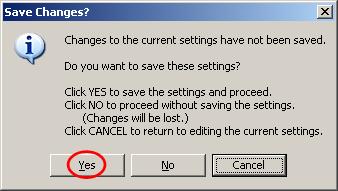
If you are prompted to save the settings, click Yes:
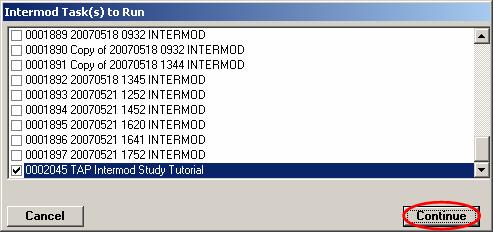
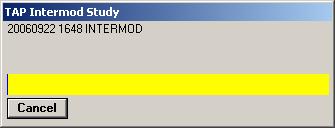
A list of available Intermod Tasks (which have not yet been run) will be displayed. Mark the checkbox for the Task(s) you want to run and click the Continue button.
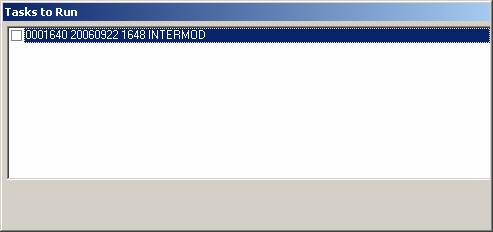
When the Continue button is clicked, the intermod study is started. The “Tasks to Run” form is displayed showing the Tasks selected to run during this session. If multiple Tasks have been selected, the box next to each Task will be marked with a check when that study is completed.
The Intermodulation Study Status form will be displayed to indicate the progress of the study.
(Note that for small studies, as in this example with only five input records, the progress status forms will be displayed only very briefly and may not be visible long enough to read.)
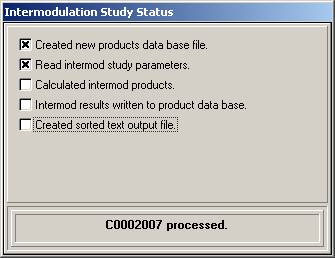
A progress bar will be displayed to show the number of intermod product calculations performed:
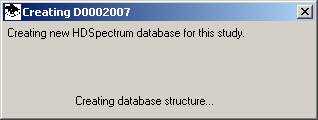
When the intermod calculations have been completed, a new database is created for HDSpectrum. For large studies, this can take several seconds:
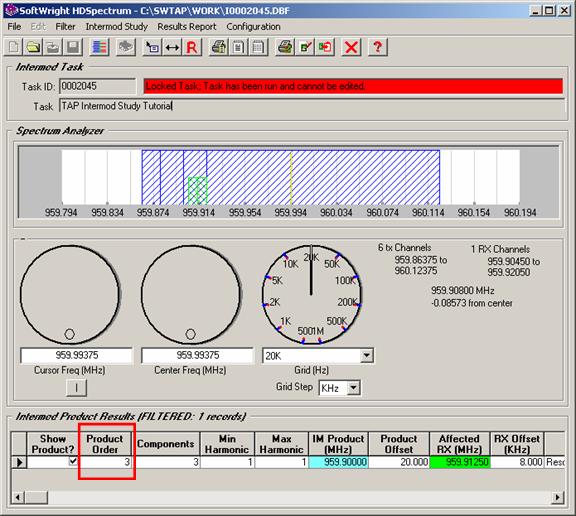
The results will be displayed in HDSpectrum. Since the study has been run, the Task is Locked. You cannot make changes to the parameters or frequencies, but you can use the Results Report filter functions to manipulate the computed results.
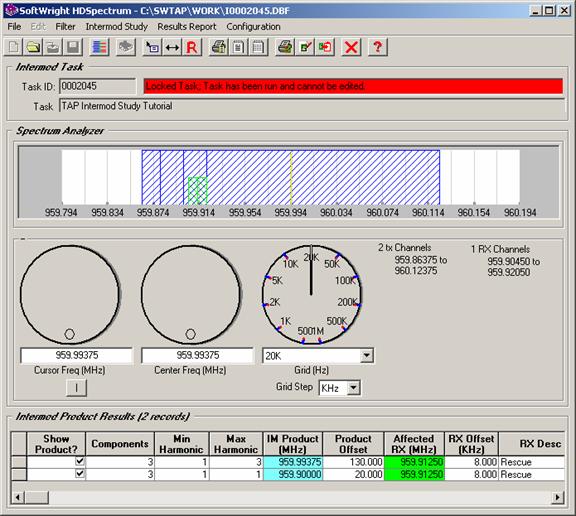
For example, in this simple example, only two intermod products have been computed. Note that one is a fifth order and one is a third order product.
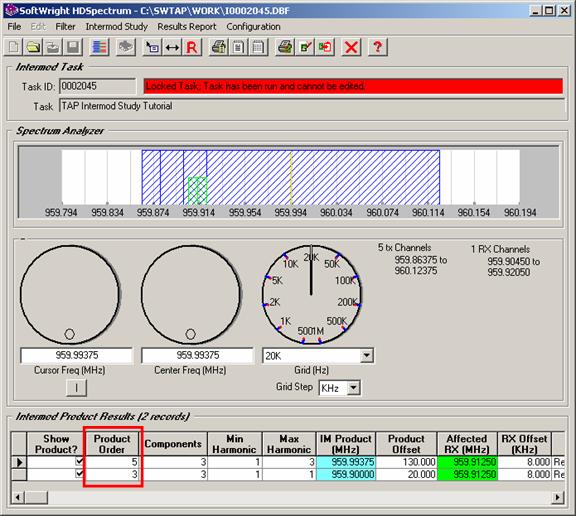
If the "Product Order" column is hidden, use the mouse to adjust the column widths. Placing the mouse over the division between columns on the column headers will display either a double-arrow (<-||->) or a single-arrow (||->) mouse icon. The double-arrow icon enables you to adjust the width of a column. The single-arrow icon indicates a column is hidden and adjusting the width will show that column.
Suppose you only want to see products up to third order (which are more likely to be real-life, practical problems than are the higher order products). With only a few products, this is easy to see. But if a more complicated intermod study (with dozens or hundreds of input frequencies) generates thousands of possible intermod products, the filtering is helpful to make the results more manageable for analysis.
To filter the order of products displayed, click the Results Report menu and select Filter:
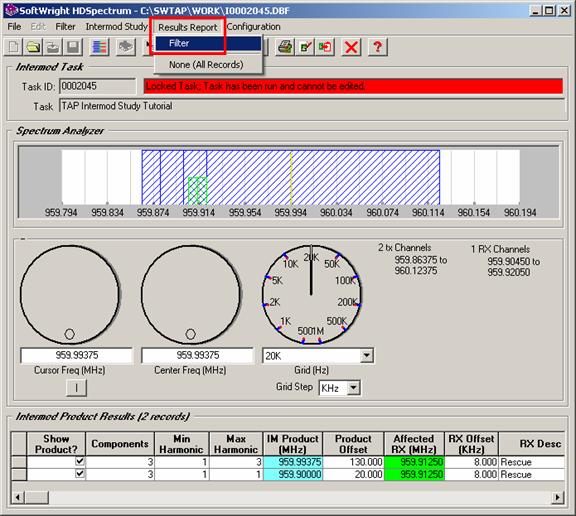
The HDSpectrum Filters form is displayed:
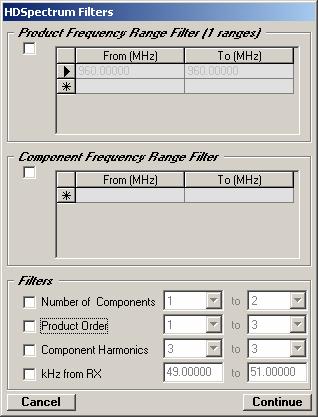
The functions of this form are described in more detail in the article on Intermod Results in HDSpectrum, including an example with several thousand intermod records.
For the current example, we want to filter by the Product Order. Check the box for Product Order, and enter the range from 1 to 3 so that HDSpectrum will display only intermod products up to and including 3rd order:
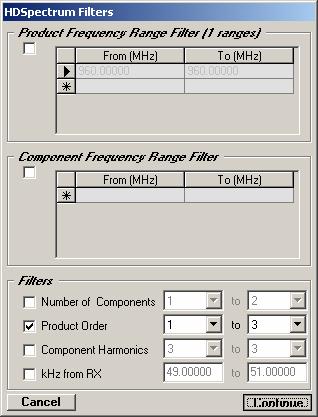
Click the Continue button to apply the filter.
The list of intermod products is updated to show only the records that match the filter:
When you have the list of results that is of interest to you, you can Print the list, or export it to a text file or a comma-delimited (.CSV) file to open in Excel.
Return to HDSpectrum Introduction
|
|
Copyright 2006 by SoftWright LLC