Printing in HDSpectrum™
Q: How do I print the results from HDSpectrum?
A: You can print the text and graphic parts of the HDSpectrum display.
(Note that all values and settings in this article are for illustration purposes only. You should determine the appropriate settings for your application using good engineering judgment.)
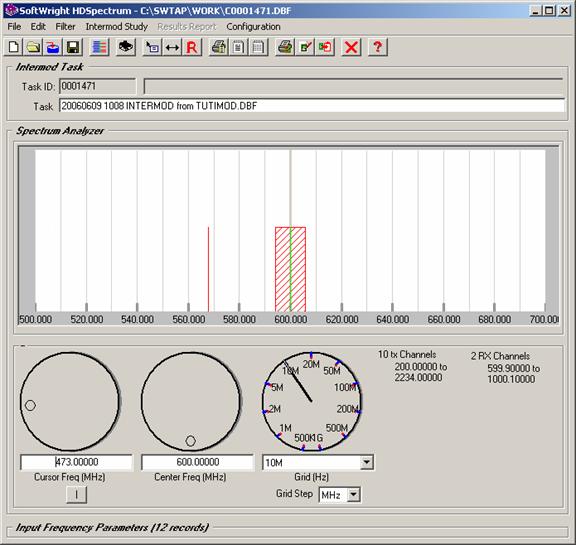
This article describes how to print the input parameters for an intermodulation study, how to export the input parameters to text or comma-delimited files, and how to save the frequency spectrum graphic to an image file. The Intermodulation Study Reports article describes how to print the results of an intermodulation study.
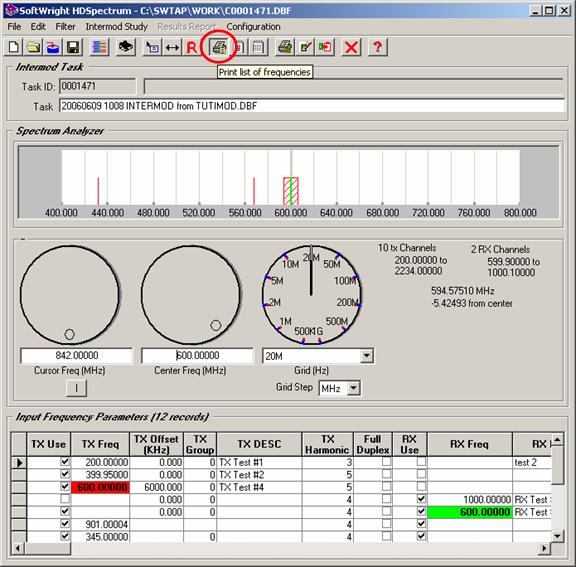
You can print the list of Input Frequency Parameter information by clicking
the ![]() button on
the toolbar:
button on
the toolbar:
You can also export the frequency parameter information to a text file or comma-delimited file that can be read and printed from other programs. This enables you to change the formatting, fonts, etc., to suit your needs. See the article on Exporting from HDSpectrum.
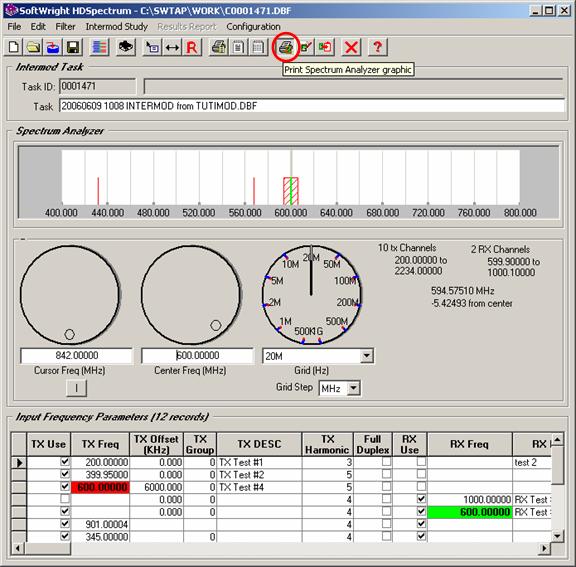
You can print the graphic section of HDSpectrum by
clicking the ![]() button
on the toolbar:
button
on the toolbar:
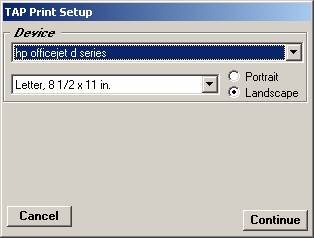
You will be prompted to select the printer, paper size, and page orientation you want:
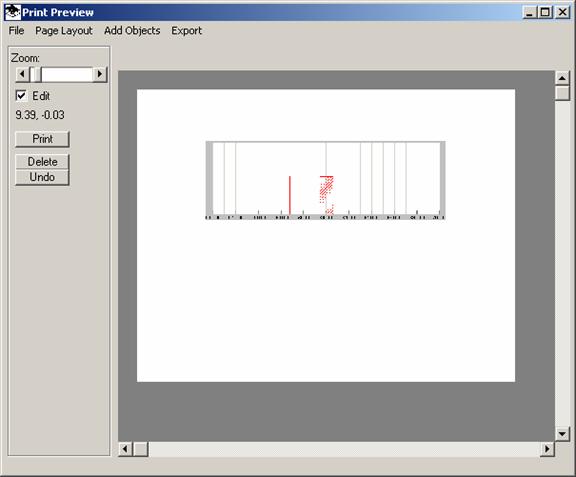
The HDSpectrum graphic will be shown on a print preview:
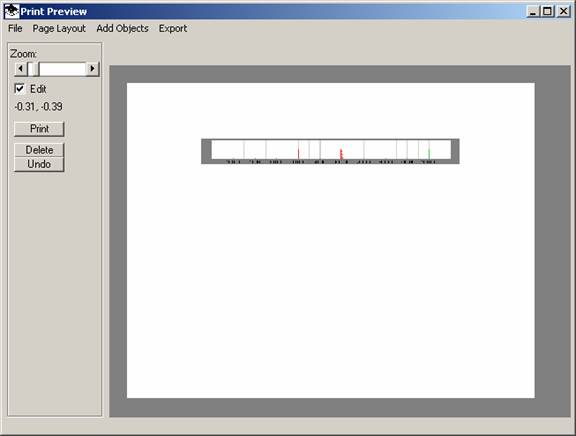
The image printed will be a copy of the display on the HDSpectrum form.
You can change the size of the graphic (or the whole form) as describe in the article HDSpectrum Graphic View.
The new graphic size will be used for the image in the print preview:
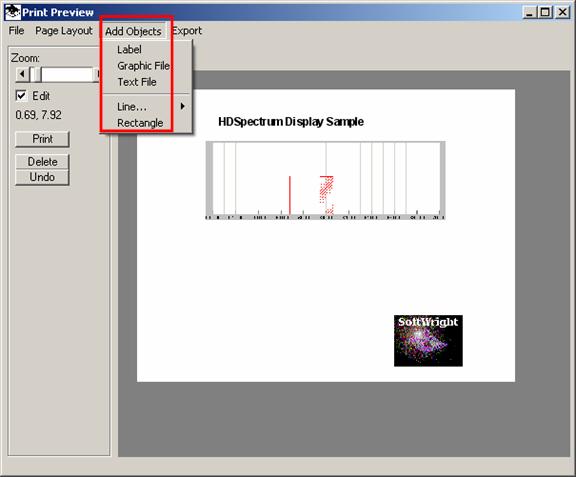
You can use the Print Preview editing functions described in Print Preview and Page Layout Function to add text and graphic information to the output. As described in that article you can save these changes into a template for future use:
|
|
Copyright 2006 by SoftWright LLC