Intermod Results in HDSpectrum™
Q: How do I view the results of an intermod study in HDSpectrum?
A: HDSpectrum gives you the ability to see the numerical information about computed intermod products that could be potential problems at the site, as well as to view the results graphically and see the overlap between computed intermod products and protected receiver frequencies.
(Note that all values and settings in this article are for illustration purposes only. You should determine the appropriate settings for your application using good engineering judgment.)
Several parts of the intermod study process are described:
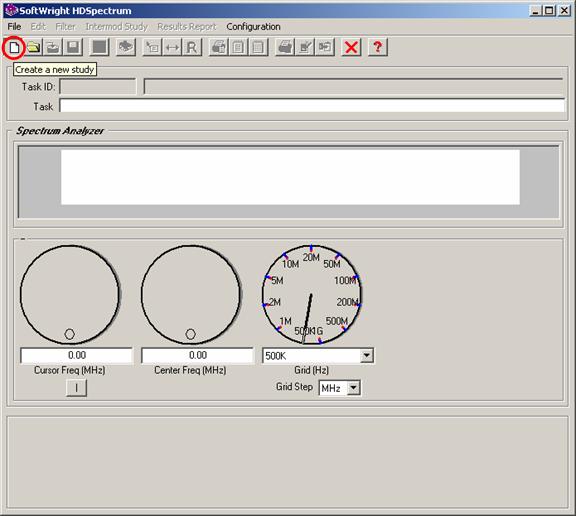
For this illustration, create a New study in HDSpectrum by clicking the New button on the toolbar:
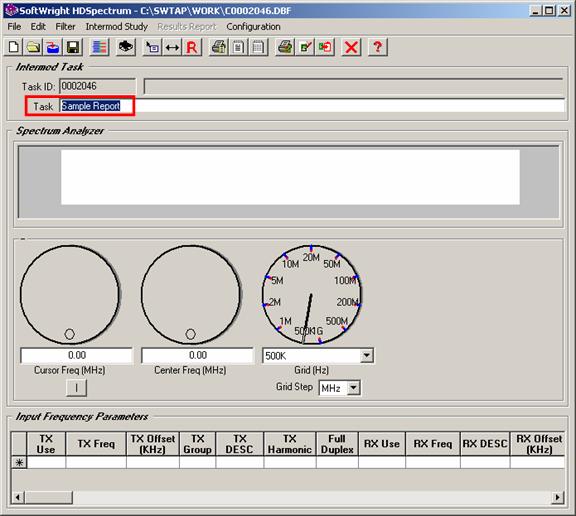
Enter a new Task description, such as "Sample Report":
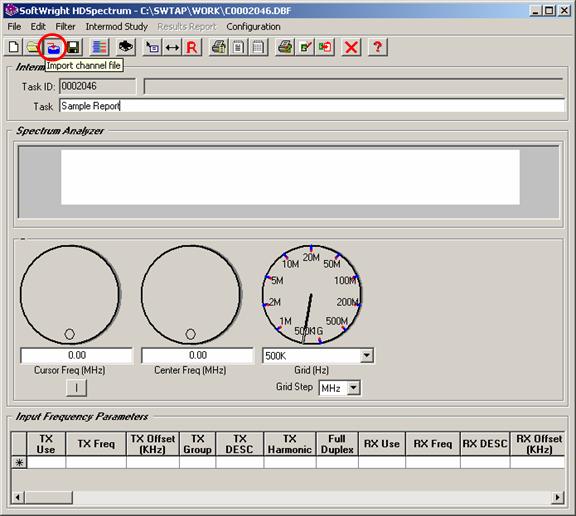
Use the Import function to add the frequencies from the "SAMPLE ALIAS FREQ.CSV" file found in the INTERMOD folder where TAP is installed. (This file is a sample of a comma-delimited ASCII file that can be edited in Microsoft Excel and imported into HDSpectrum.) Click the Import button:
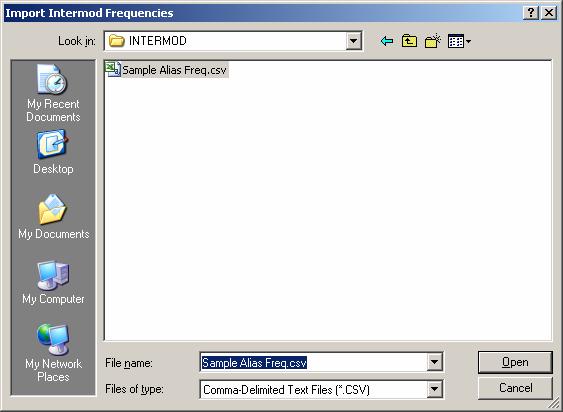
Click the Browse button to find the file to import:
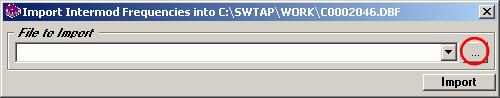
Select the desired file to import:
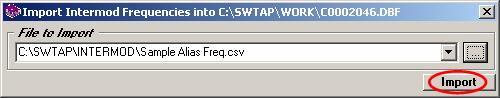
Click the Import button to start the process:
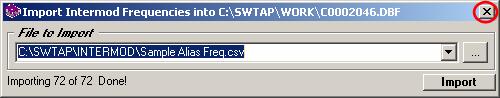
When the file is imported, click the "X" to close the import form:
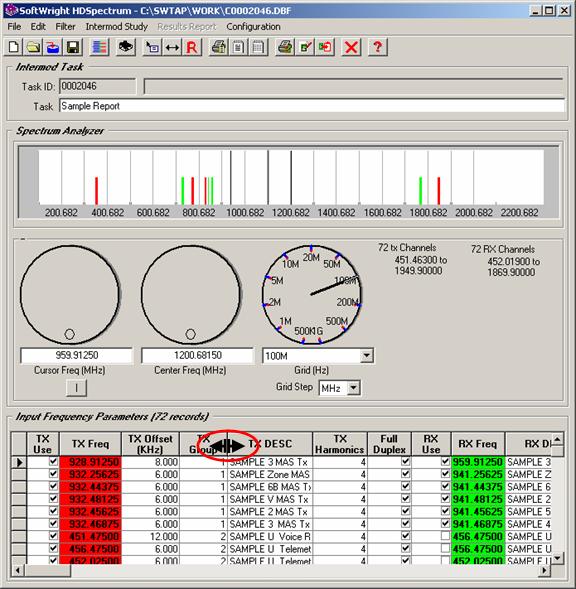
The frequencies will be imported into the "Input Frequency Parameters" grid and displayed in the Spectrum Analyzer graphic:
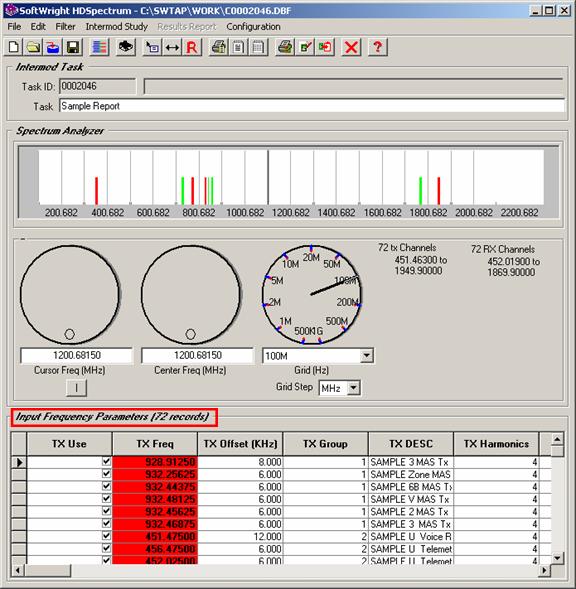
You can adjust the column widths for a better view of the data:
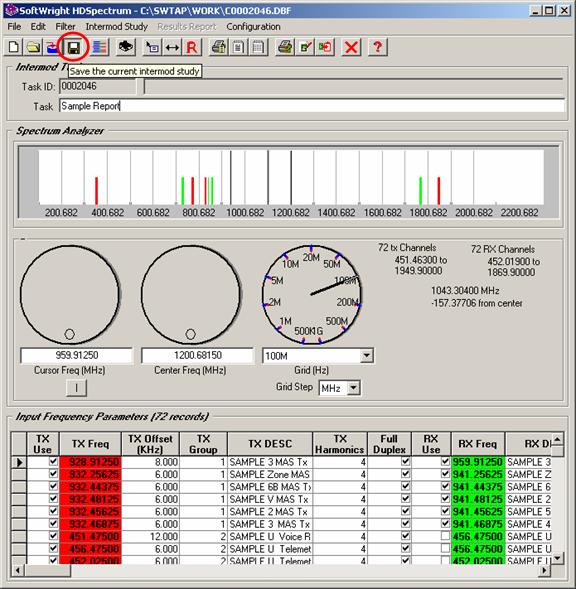
To save the study, click the Save button:
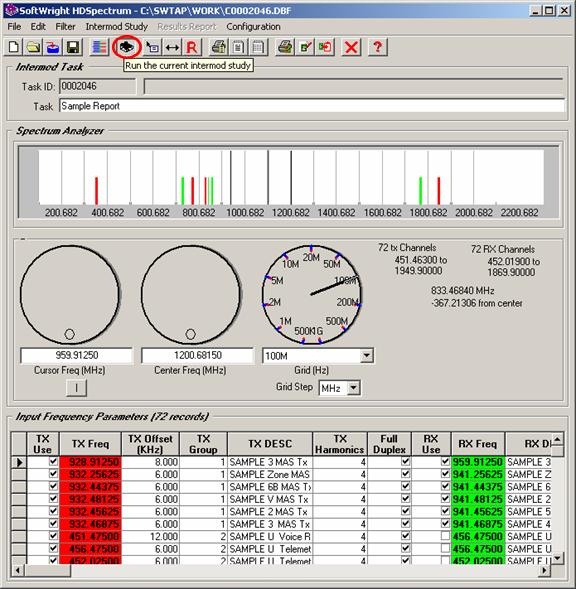
Then to run the study, click the Run button:
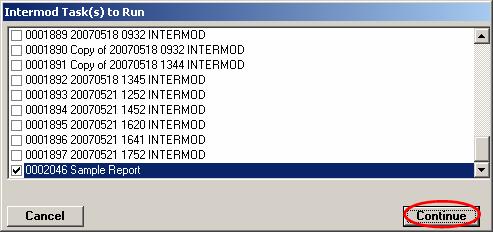
A list of intermod studies will be displayed. You can run multiple studies by checking the box for each study. For this sample, just run the current study by clicking the Continue button:
Progress forms will be displayed to show the progress of the study:
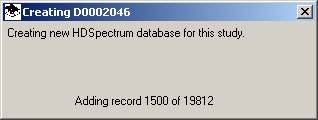
When the study is completed, the program will create a new database for the intermodulation study results. This may take several minutes:
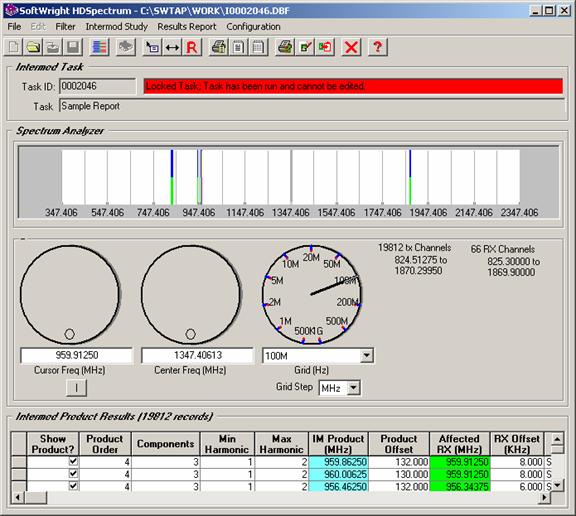
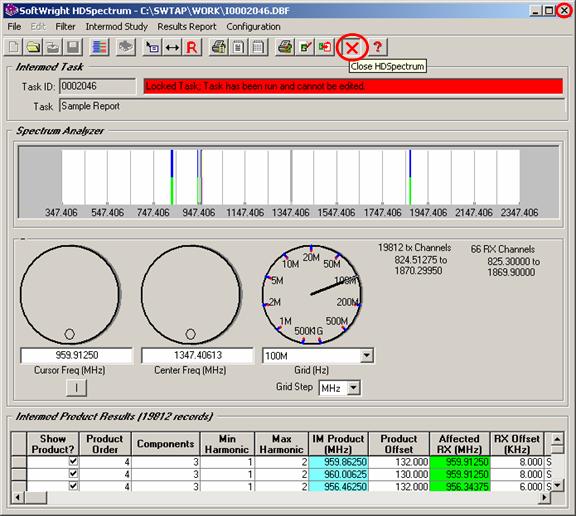
The results will be shown in the HDSpectrum form:
This form enables you to use the filter and reporting functions displayed below. For this exercise, close the form now so the process of opening the results from a previous study can be demonstrated. Click the Close button or the X in the upper right corner of the form to close HDSpectrum:
Normally, after running the study you can proceed with the filtering and reporting functions and it is not necessary to close and reopen the study.
Also, if the setup form for creating the study in HDSpectrum you can close that form as well.
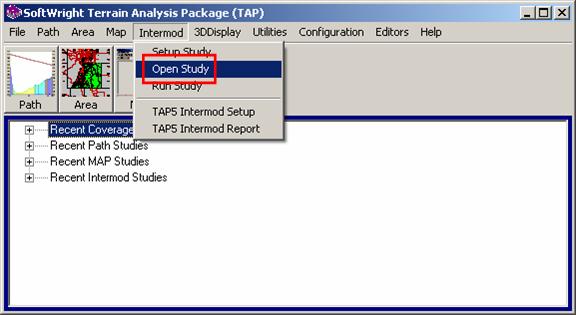
Then start HDSpectrum again from the TAP menu by clicking Report in the Intermod menu:
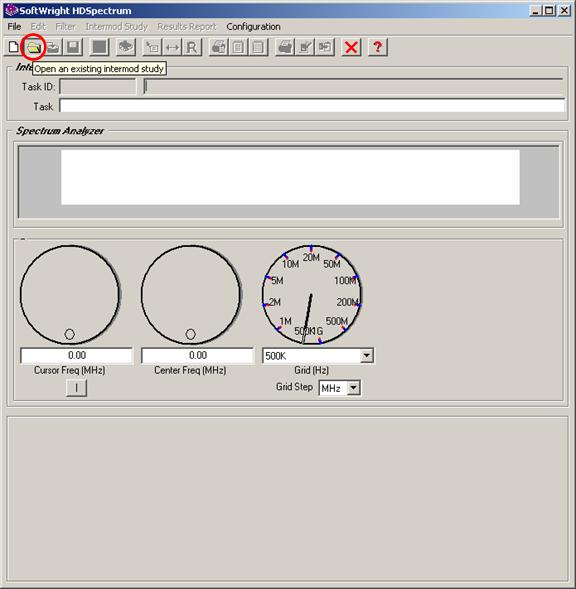
The HDSpectrum form will be displayed.
Open an Intermod study with the ![]() Open
Intermod Study button:
Open
Intermod Study button:
A list of intermodulation studies, or “Tasks” will be displayed. Select the study you want to open:
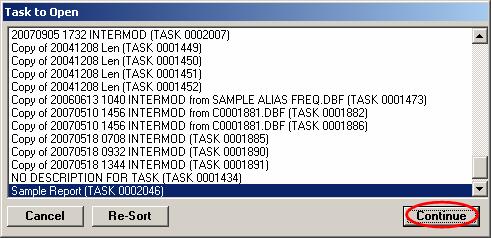
Click the Continue button.
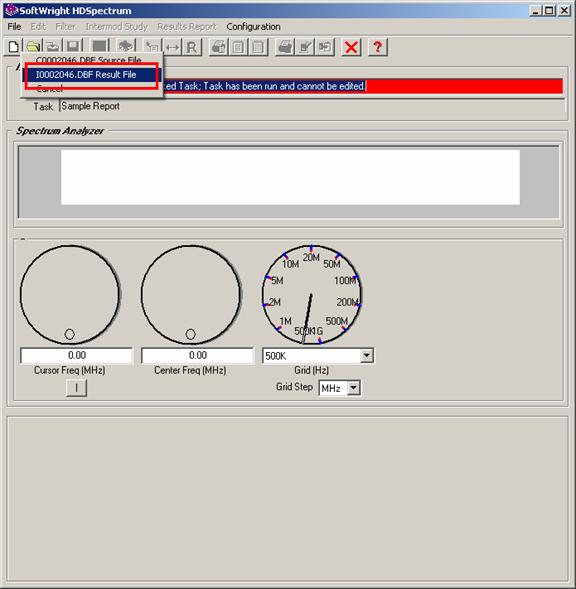
When you open an intermod study that has already been executed, you can open either the Source file (containing the frequencies used in the study) or the Results file. Select the Results file from the popup menu:
If this is the first time you have opened the intermod results file for this Task in HDSpectrum, a new database will be created:
Depending on the size of the study, this operation may take several seconds or even several minutes for large studies.
The database only is created the first time you open the results for a Task. The next time you open the same Task the process will be much faster.
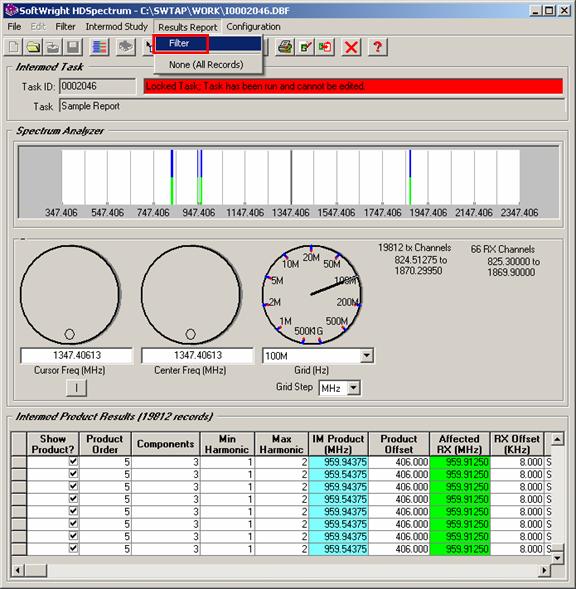
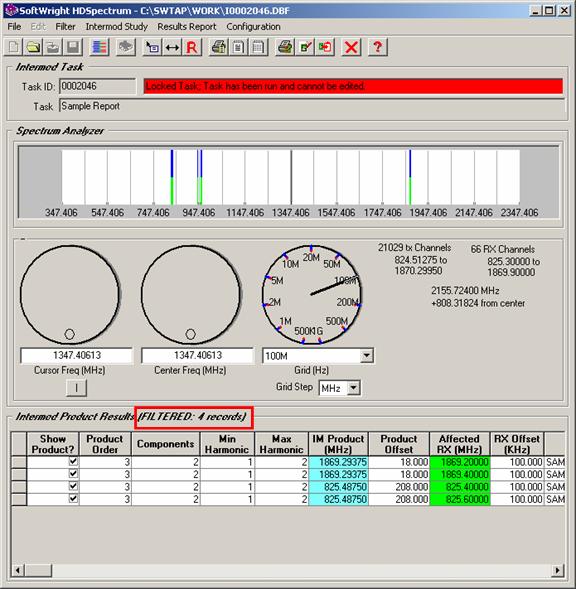
When the database has been created, the results are displayed in HDSpectrum:
Since intermod studies can produce a large number of possible intermod products, it is helpful to be able to filter the results. If you are looking for the cause of a specific problem (for example, suspected intermod interference to a particular receiver frequency), the filtering function enables you to narrow the results to those that are the most likely causes of the specific problem.
The filtering function in HDSpectrum enables you to further refine the results of the intermod study that you set up and ran. You can use the filters to further restrict the results, but not to expand the results. For example, if you ran an intermod study looking at combinations of a maximum of three frequencies at a time, you can filter the results to view only those products that result from two frequencies. But the three-frequency study cannot be used to look at more frequencies, such as four at a time, since those combinations were not included in the original study.
The Results Filter function is available when you are viewing the results of an intermod study. If you are viewing the input transmitter and receiver frequencies for a study, the Results Filter function is disabled. The general Filter functions are still available in both cases.
The Results Filter function is available from the “Results Report” menu by clicking “Filter”:
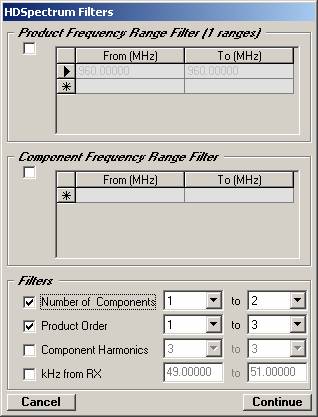
The HDSpectrum Filters form is displayed:
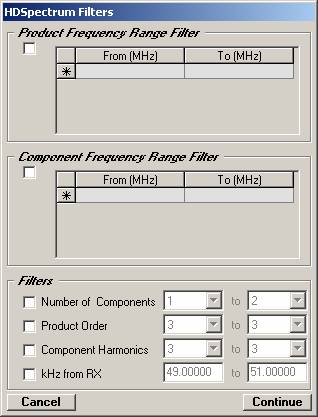
This form enables you to select a wide variety of filter specifications:
Each of the filters is selected using the checkbox to the left of the filter. If the checkbox is marked, you can select or specify the values to be used in the filters.
The filters are combined as logical “AND” statements. For example if you specify a range of intermod products from 100 to 200 MHz, and a filter of 1 to 3 components, the intermod products will be selected and displayed that meet both criteria: in the desired frequency range AND with the desired number of components.
If you specify multiple range for intermod products or components, the ranges are combined as logical “OR” statements. For example, if you specify intermod products in the ranges 100 to 200MHz and the range 400 to 500MHz, the intermod products will be selected and displayed that are in the range 100 to 200 OR the range 400 to 500.
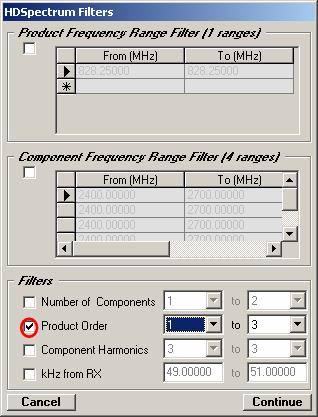
As an example, suppose you want to see the intermod products at 828.25MHz which contain only one or two components. The HDSpectrum Filters form would be used as shown:
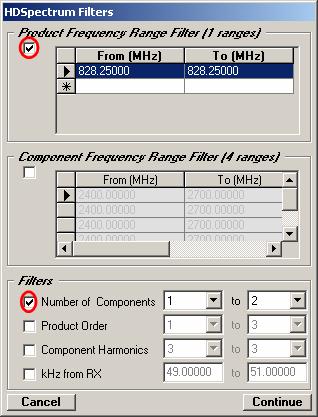
To add a frequency in the Intermod Products or in the Component Frequency range grids, start typing in the last line, the line with the asterisk “*” in the left column. A new range will be added.
To remove a frequency range from either of the grids, click on one of the values in that range to put the mouse cursor on that line. Then click the selection button to the left of the row to highlight the range. Then press the Delete key on your keyboard.
When the Continue button is clicked, the filter is applied. The number of results is dramatically reduced, making analysis more manageable:
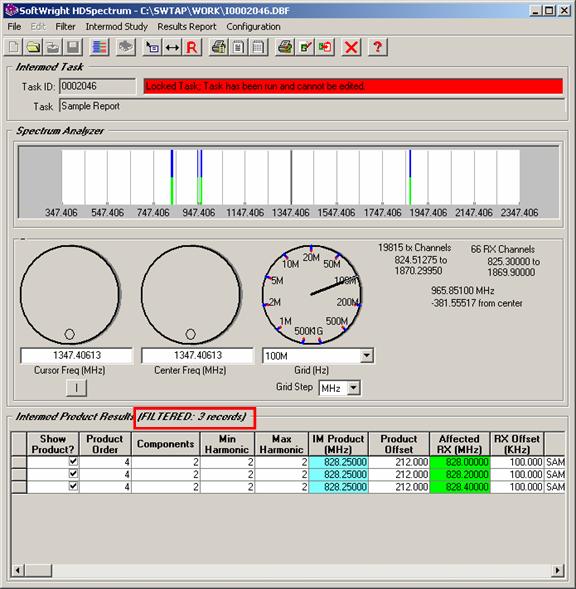
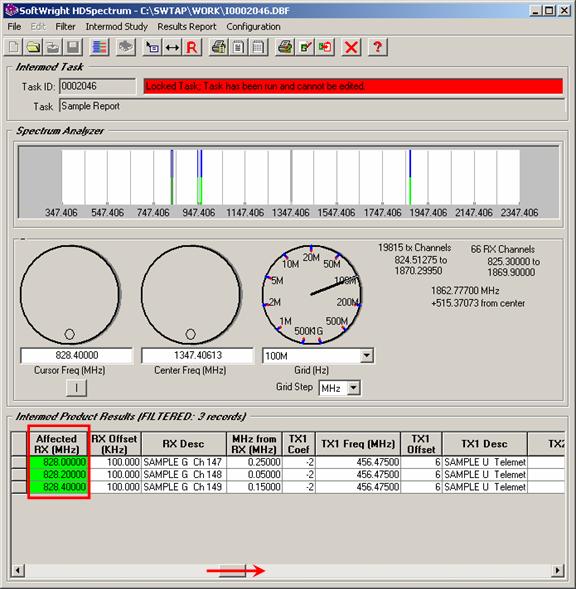
You can scroll to the right of the Intermod Products Results list to see the potentially affected receiver frequencies and the component transmitter frequencies:
This kind of filtering is useful, since intermod products created using two components are more likely to be actual problems than those resulting from more components.
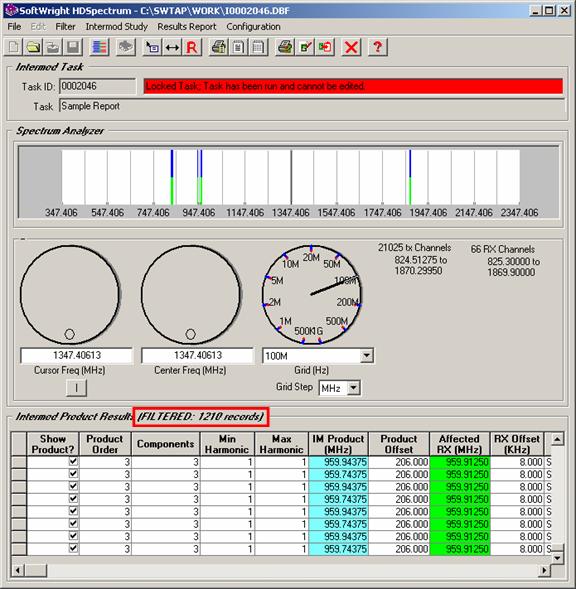
As another example, suppose you want to see only intermod products of third order or lower. Once again, this is a useful filter, since lower order products are more likely to be actual problems. The HDSpectrum Filters form is set up as shown:
The first- through third-order intermod products in this example are less than 10% of the total number of products.
Specifying 1st – 3rd order products with no more than two components further narrows the number of possible intermod products:
With the results as:
As you can see, many more useful combinations can be created using the Results Filter function that can be adapted to your particular needs.
For information on printing the results of an intermodulation study, see the Intermodulation Study Reports article.
|
|
Copyright 2006 by SoftWright LLC