We are pleased to announce today that we have released Terrain Analysis Package (TAP™) 7.3.4, which features a new way to include building wall and penetration losses in TAP path and coverage analyses.
TAP 7.3.4 includes many user-requested enhancements as well as the building penetration loss maintenance feature that is available with a maintenance subscription expiration date of March 1, 2020 or later. Enhancements available to all users include:
- TPO-ERP Calculator: New Calculator Tool Utility that will calculate Effective Radiated Power (ERP) from Transmitter Power Output (TPO) and vice versa based on the entered transmission gains and losses.
- Required Field Calculator: New Calculator Tool Utility that will calculate Required Field from the Receiver Sensitivity and entered receiver gains and losses.
building wall and penetration losses using vector surface features
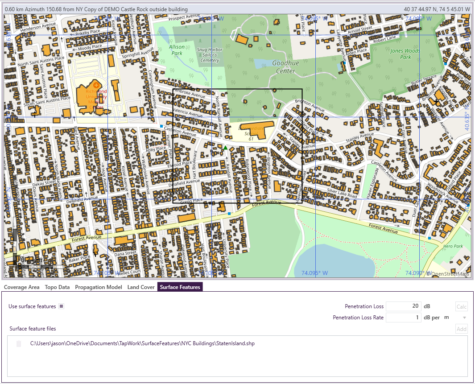
Until now, TAP 6 and TAP 7 surface features were modeled as cylinders with location, radius, height, and type. With today’s release of TAP 7.3.4, any vector file containing polygons can be used as a TAP surface feature obstruction. This is particularly useful in representing buildings. Simply go to the Surface Features tab of the TAP 7 Path or Coverage Study and add the surface feature file. In the example cases, the files contain buildings in Staten Island and Brooklyn, NY, constructed using the Obstructions utility in TAP Mapper. If needed, a Calc button provides an estimate of medium building penetration loss (from TSB 88.2) as a function of frequency and reliability.
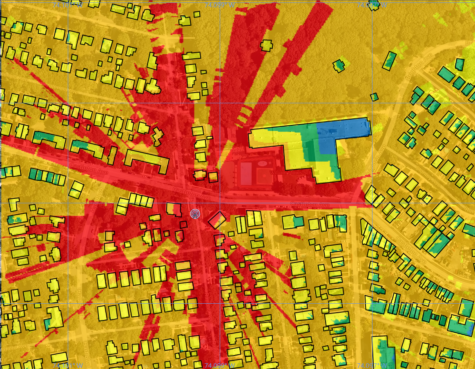
The user can set two loss parameters. The first is a constant Penetration Loss that is applied when a transmitter or a study point fall within a building (i.e., within the building footprint, with an AGL height below the building height) and the path traverses an external wall of the building; if the transmitter and study point fall in different buildings, the constant loss is applied twice. The second is a Penetration Loss Rate, expressed in dB per distance unit, that applies a loss according to the depth within the building. For example, for a Penetration Loss of 20 dB and a Penetration Loss Rate of 0.3 dB/m, if a point study point falls within a building and it is, say, 15m from the external wall, total penetration loss would be 20+(15*0.3) = 24.5 dB. All the buildings that fall between the transmitter and a study point are modeled by raising the terrain by the respective building heights; similar to the treatment of Clutter-type TAP6 surface features. The loss parameters can be set either globally, or per surface feature file, or per building (by setting fields within a shape file).
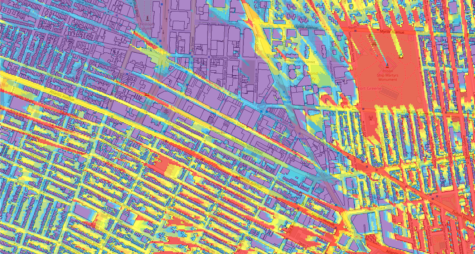
Run the coverage study and when it completes, building penetration losses will be apparent inside buildings and RF shadowing will be apparent behind buildings. Note that in Fig 1 above, the signal fades according to the set dB/m loss inside the large building near the center of the study. The signal level is higher on the end of the building nearest to the transmitter and fades (shown in blue) on the far side of the interior of the building. In Fig 3 below, the transmitter is at the lower right and the coverage study result shows shading due to buildings and obvious higher signal strength along unobstructed streets and in open areas.
acquire building data using the tap obstructions tool
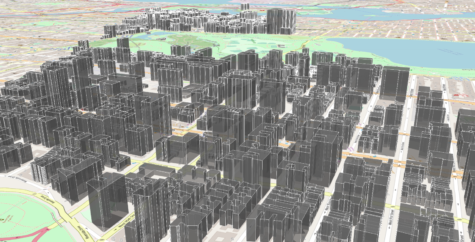
Many studies in urban and suburban areas could more accurately model the effect of buildings with the inclusion of vector surface features. Recall that TAP Mapper, which is the visualization tool provided with TAP 7, offers an Obstructions feature that may be used to acquire building data for inclusion in TAP 7 studies. A widespread global database of 3D buildings is available from Open Street Maps (OSM). However, it does not include every building or other structure (water tower, wind turbine, etc.) that may impact RF propagation.
Users can import OSM buildings for an area of interest and use the Obstructions tool to manually enter location and height information for known obstructions not available from OSM. The OSM and manual obstructions may then be saved together in a single surface feature shapefile for use in TAP path and coverage studies.
For more information on TAP 7.3.4 and how to upgrade to this latest version, please contact Curt Alway at curt.alway@softwright.com or call 1-800-728-4033 x1.