We are pleased to announce today that we have released an update to Terrain Analysis Package (TAP™) Mapper 2016 that includes two new analysis tools: Data Summation and Intersecting Contours. Recall that TAP™ Mapper 2016 installs alongside existing TAP™ software and provides an alternative to the current HDMapper for visualizing, exporting, and analyzing coverage study results. These new Mapper tools expand on the capabilities of similar tools found in HDMapper, offering easier configuration and improved results presentation. The new analysis tools, described below, are available for customers having maintenance subscriptions that expire December 1, 2016 or later. This Mapper update also includes improvements, available to all users, for loading coverage layers and setting layer styles.
TAP™ Mapper Data Summation
Data Summation is the summation of point data from point-type shapefiles over geographical areas covered by polygon-type shapefiles. The most common Data Summation usage is for conducting population counts wherein the population covered by a tile-type area coverage study is calculated by adding up the population residing within the areas covered by RF signal strength at user defined levels of interest. U.S. block centroid population data for the 2000 and 2010 census are available from SoftWright to facilitate population counts, which are often required for public safety communication systems.
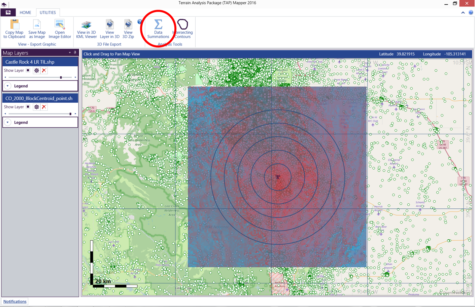
The figure above shows a tile coverage study result as the top Mapper layer with signal strength shading from light blue (lower signal strength) to red (higher signal strength) around the transmitter. The second map layer is block centroid population data for Colorado for the 2000 census. It is shown as a green ellipse marker with white fill. The point data could be any point-type shapefile containing numerical data fields. In order to conduct a Data Summation, at least one point-type shapefile and one polygon-type shapefile must be loaded in Mapper. Now that this criteria has been satisfied, launch the Data Summations dialog by clicking on the summation icon in the Utilities tab of the Main Window. The Data Summation dialog window below will appear.
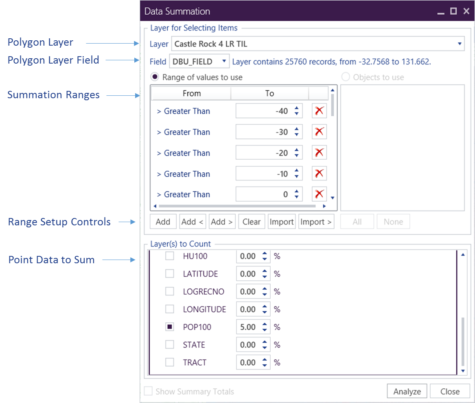
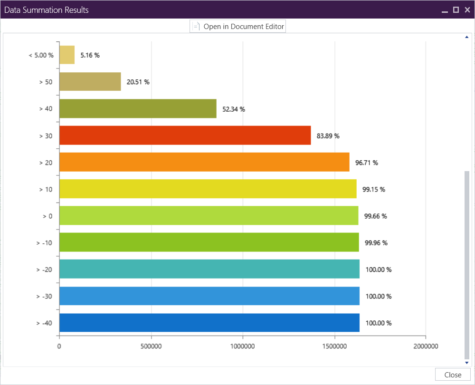
Select the polygon layer that covers the region of interest, define the summation ranges, select the point data to sum, and press the ‘Analyze’ button. A report will be generated that includes tabulated and graphical results showing, in this case, the population covered at each defined signal level range. An example chart of results is shown below.
Complete, detailed instructions for how to set up and run Data Summation analyses are included in the new release of TAP™ Mapper and here.
TAP™ MAPPER intersecting contours
Intersecting Contours provides a tool for the summation of point data from point-type shapefiles over geographical areas covered by a set of intersecting polygon-type shapefiles. The most common Intersecting Contours usage is for conducting population counts wherein the population covered by the intersection of two sets of contour studies is calculated by summing the population residing within the area defined by the contour overlap.
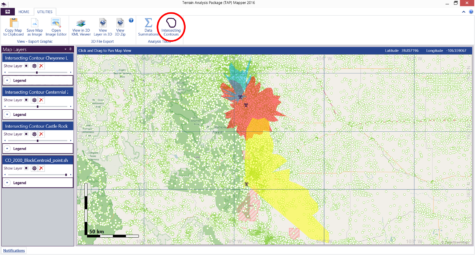
The figure above shows a set of three contour studies created using TAP™ and displayed as blue, red, and yellow polygon regions. The fourth map layer is block centroid population data for Colorado for the 2000 census. It is shown as a green ellipse marker with white fill. The point data could be any point-type shapefile containing numerical data fields. In order to conduct Intersecting Contours analysis, at least one point-type shapefile and one polygon-type shapefile must be loaded in Mapper.
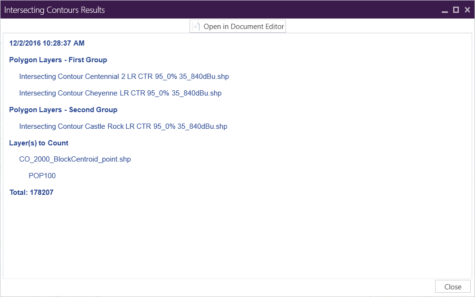
The Intersecting Contour report shows the total population covered by the intersecting contour region. As shown above, the Intersecting Contour Report has a table that shows the point data (population from the 2000 census in this case). In this example, the Intersecting Contour region that we have selected has a population of 178,207. Complete instructions for setting up and running Intersecting Contours Analysis are available in TAP™ Mapper and here.