
Layer Order
Q: How can I control how different coverage studies and boundary files are displayed on my coverage map?
A: The Layer Order button enables you to control the visibility and plot order of layers on your coverage map with TAP version 4.5.973 systems with a Maintenance Subscription date of March 22, 2004, or later.
(This article describes layer order function for the TAP4 Map Window. For information on arranging layers and other control in the TAP5 HDMapper function, see the HDMapper Layer Order article.)
The Layer Order button provides the simplest and most direct control over layer plotting. As discussed in other articles, TAP provides Drawing Layer Management and Layer Control options for additional control of layer properties on a coverage map.
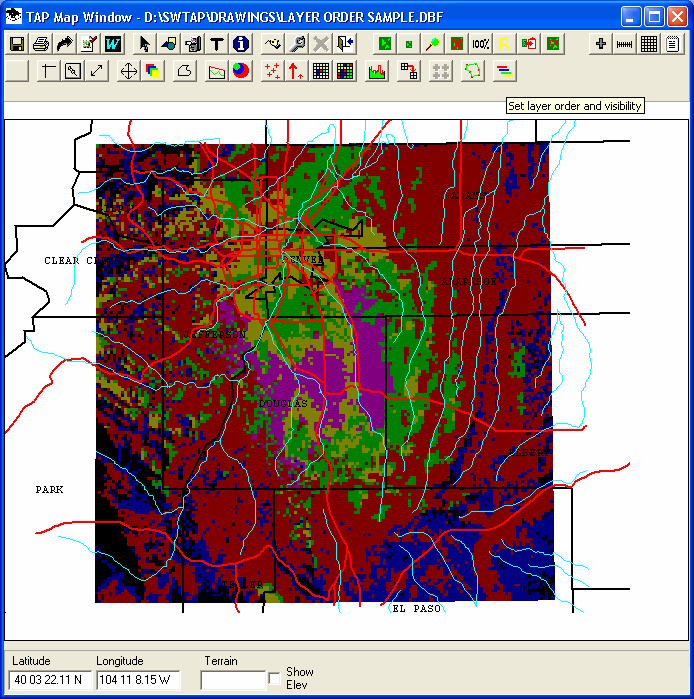
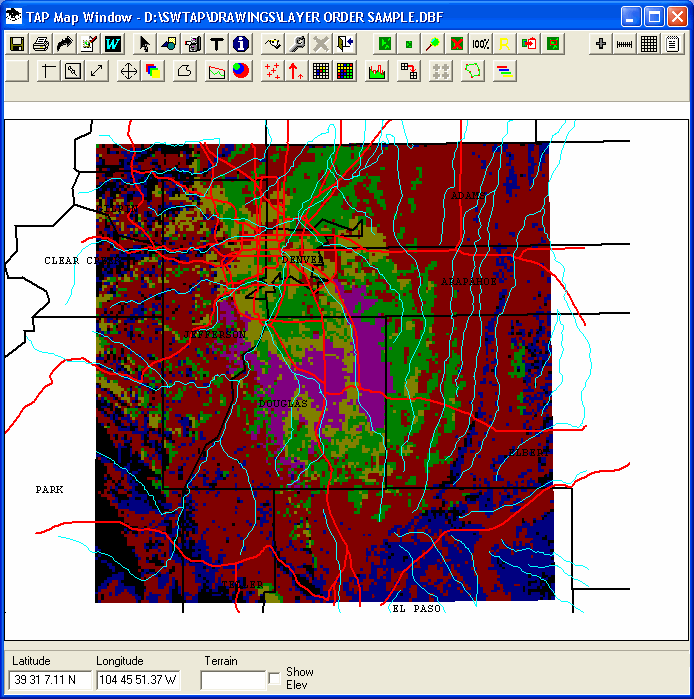
For example, consider the coverage map showing a tile study, county boundaries, rivers and roads, as well as the labels for the counties:
Notice that the "Denver" text near the upper center of the drawing is obscured by the roads (red lines) and rivers (blue lines). Click the Layer Order button on the toolbar:
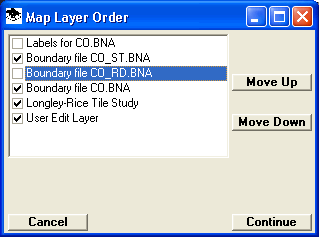
The Map Layer Order form is displayed:
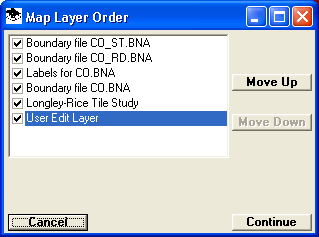
The Map Layer Order form shows the layers in the order they are plotted (in this example, the "Boundary File CO_ST.BNA" is the top layer, and the "Labels for CO.BNA" layer is the third layer down.
To move the label layer up in the order to make it more visible, click the line (not the check box) to highlight the layer:
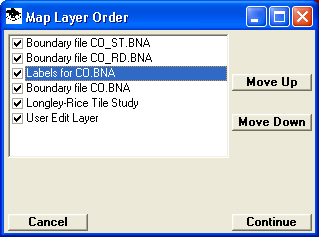
Then click the "Move Up" button twice to move the layer to the top of the list:
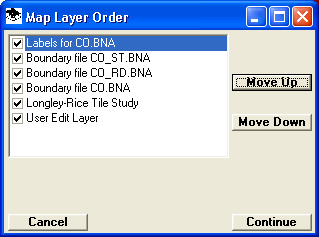
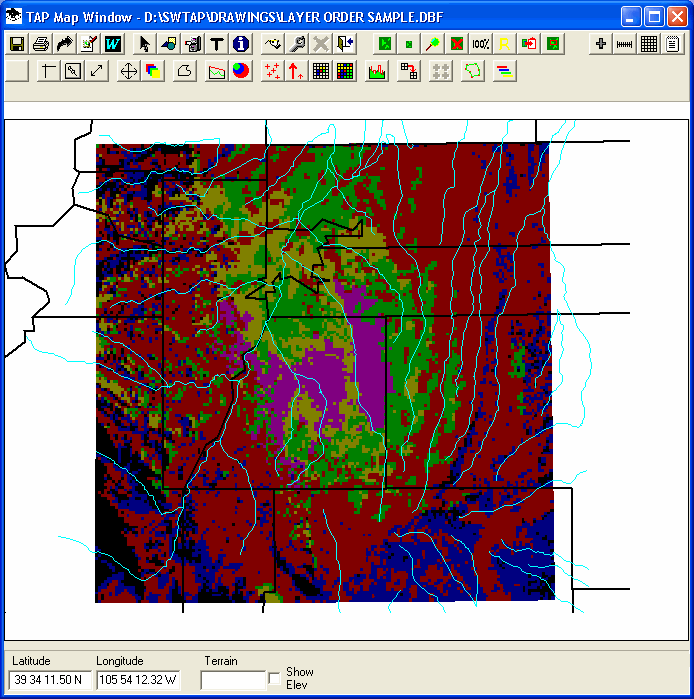
Now when you click the Continue button, the coverage map will be redrawn with the labels layer on the top of the drawing:
You can use the check-boxes on the Map Layer Order form to make layers visible or invisible. For example, uncheck the labels and the CO_RD.BNA layers:
Now the drawing will be shown without those layers visible:
Copyright 2004 by SoftWright LLC