Map Window Plots: Boundary files
OBJECTIVE: To understand how to open and use the TAP Map Window, including creating a drawing and using the Zoom, Scroll, Refresh, Calc and ID functions.
Click on the File menu, then on the New Map option:
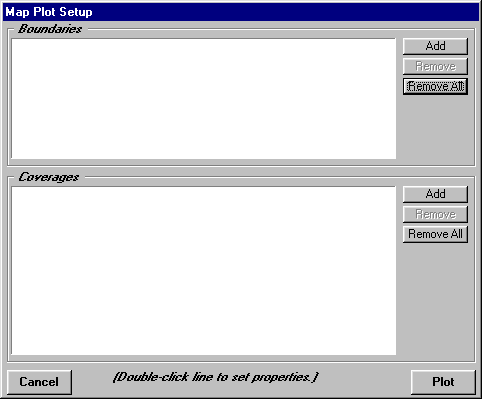
This will open the Map Plot Setup form. This form allows you to specify boundary files and computed coverage information:
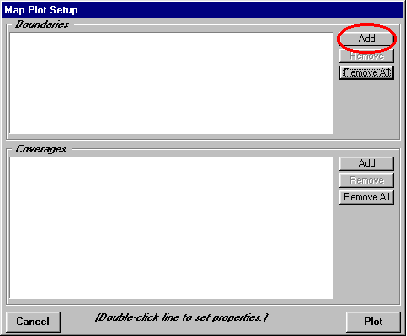
In the Boundaries frame, click on the Add button to select the boundary file(s) to plot:
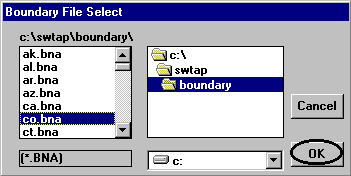
Use the normal Windows functions to select the drive, directory and file. If you have a SoftWright CD with boundary files (such as the Grid Engine disk) you can find the boundary files there. You can also find the files in the BOUNDARY directory located under the directory where TAP is installed, usually \SWTAP.
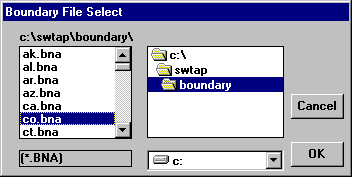
Select the file C:\SWTAP\BOUNDARIES\CO.BNA and click the OK button:
The CO.BNA file is added to the list in the Boundaries frame of the Map Plot Setup form:
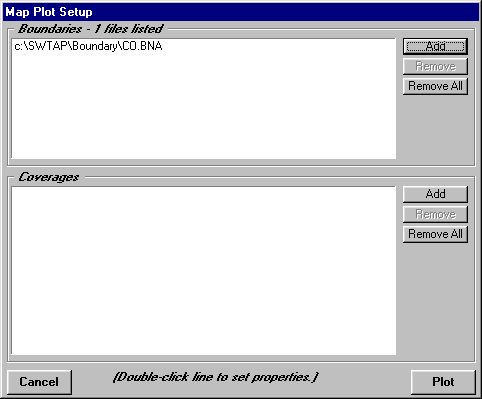
(Note that you can select multiple files to add by using the Shift or Ctrl keys when selecting the files.)
Double-click on the CO.BNA line to open the Properties form.
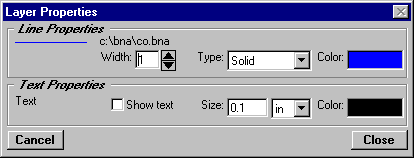
Double-click on the color block. A palette will be displayed to allow you to choose the color you want for the boundary file.
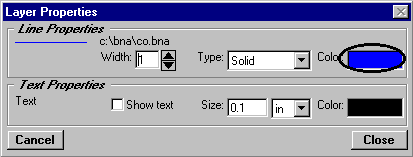
Select the line width you want.
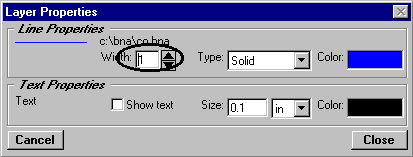
Be sure the Show Text box is not checked.
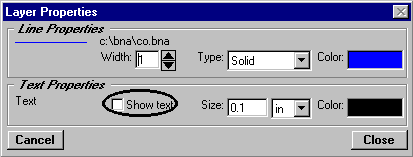
The "Show Text" box is checked if you want to automatically add the label for each boundary file object, such as county names. Leaving the box unchecked omits the labels from the drawing.
Click the Close button to close the form.

Click the Plot button on the Map Plot Setup form.
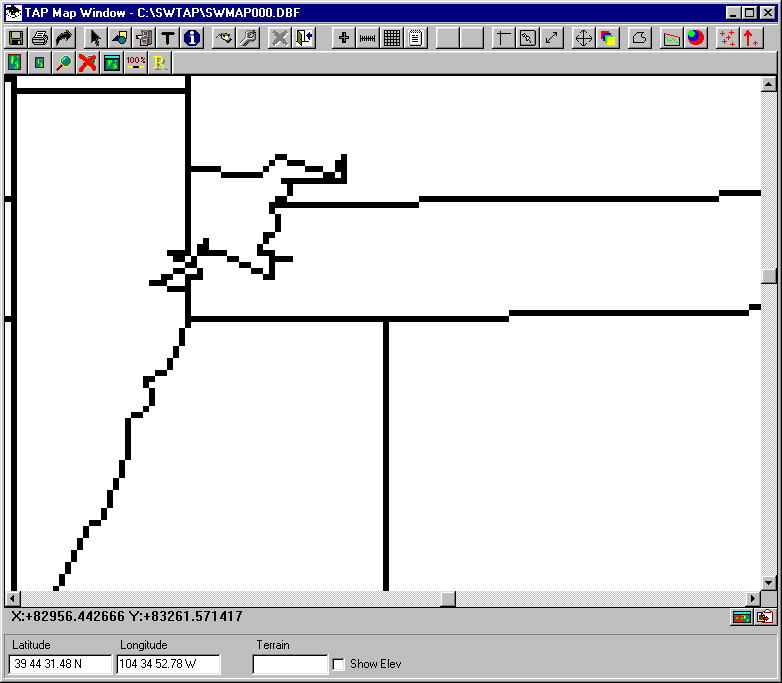
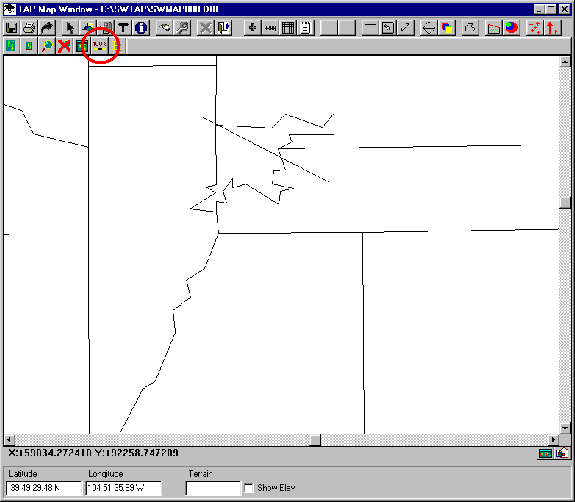
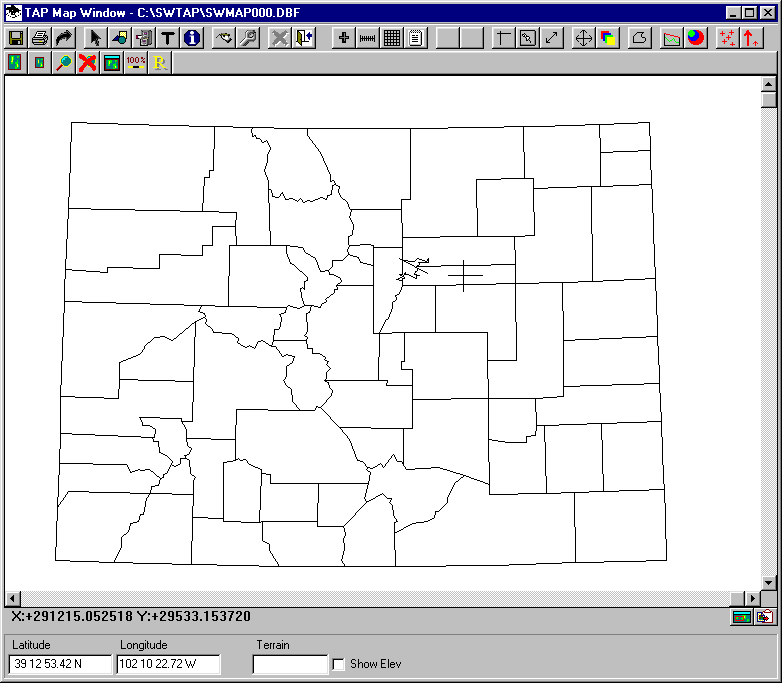
This will open the Map Window and draw the boundary file:
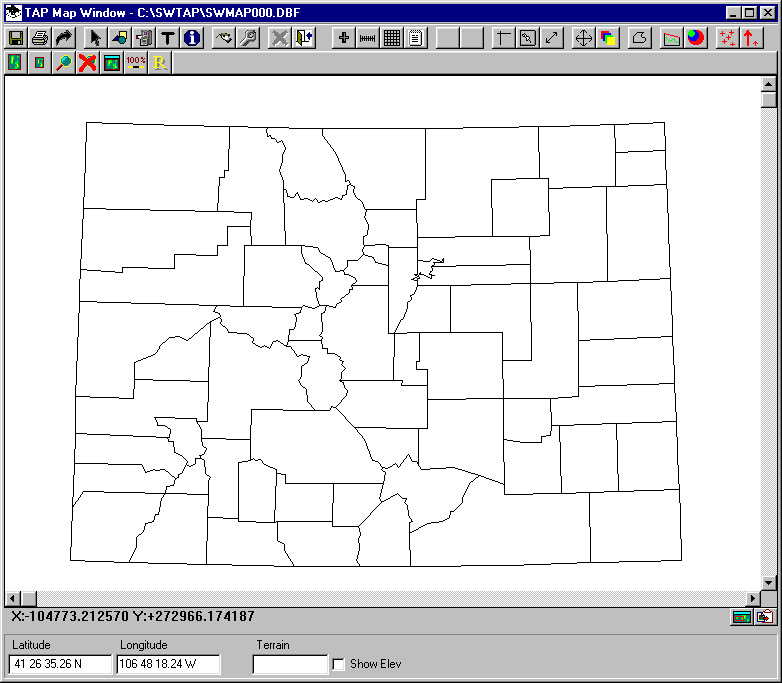
(Note that the X-Y coordinates at the lower right of the Map Window are based on the currently specified map projection, so the values may not be in the same range as those shown in these illustrations.)
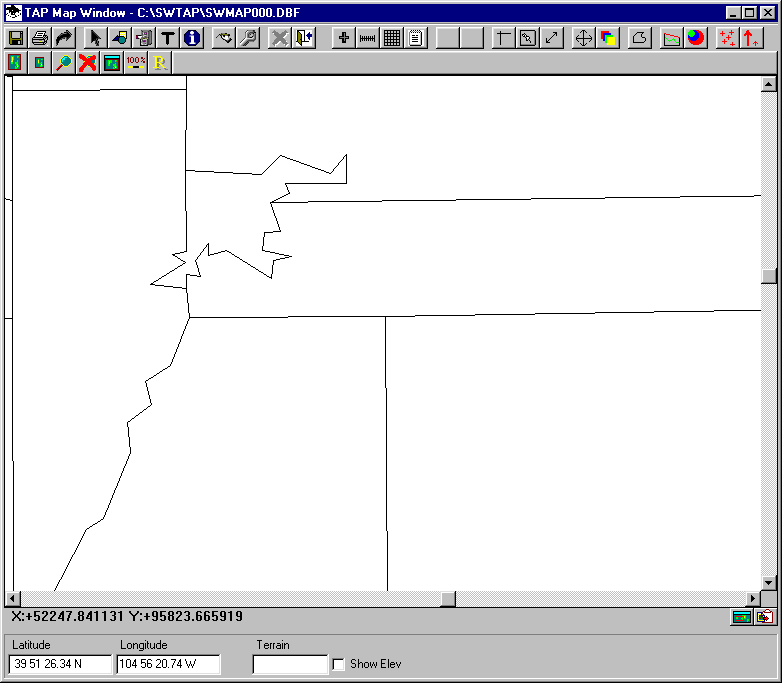
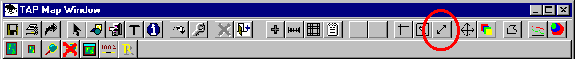
To Zoom into an area of the drawing click on the magnifying glass button:
You will be prompted to draw a rectangle around the area you want. Click one point to define the first corner, then a second point to complete the rectangle for the area to zoom:
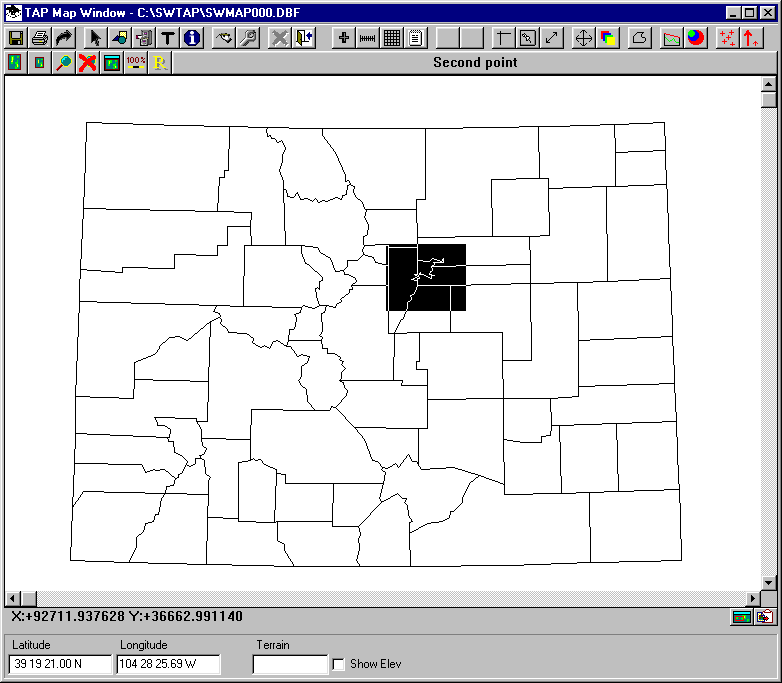
This will zoom into the drawing:
The Zoom action also enlarges the drawing pixel sizes, resulting in the wider, jagged lines. To Refresh the drawing, click on the button with the "R" to draw the lines at normal width.
Use the scroll bars on the bottom and right sides of the Map Window to move around the drawing. You will note that at some point, parts of the drawing may not be displayed, and the "R" (refresh) button assumes a red background:
When the Refresh button is used (as described above) only the part of the drawing currently displayed is refreshed. As you move away from that part of the drawing, the Refresh button changes to red as a reminder that you can press the Refresh button again for the new area of the drawing.
On the TAP Map Window Control form (above the Map Window), click the Calc button:
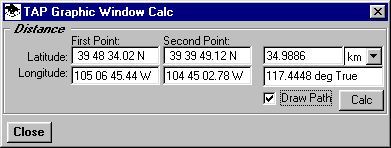
This will open the Calc form to compute distance and azimuth between points on the map.
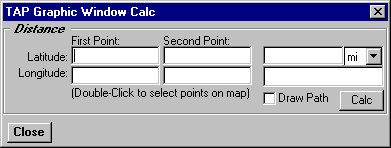
You can enter the coordinate values of the points manually, or you can double click on the latitude or longitude boxes to locate the point(s) on the map.
Mark the "Draw Path" check box on the form:
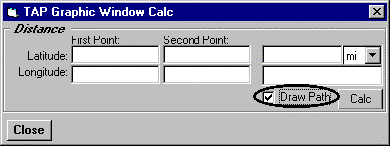
If this box is not checked the distance and bearing will still be computed, but the path will not be shown on the map.
Double click one of the boxes to define the points for the calculation:
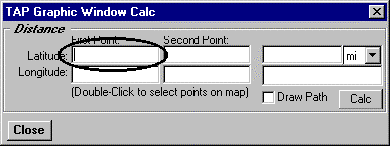
You will be prompted to click on the map to define the latitude and longitude. Click on two points on the map.
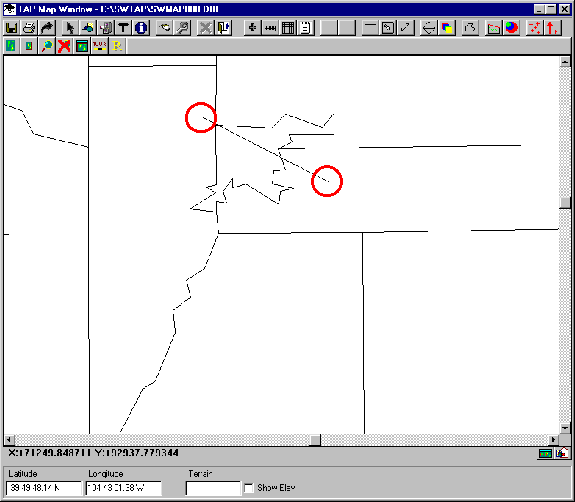
The coordinates of the points will be displayed, along with the computed distance and azimuth:
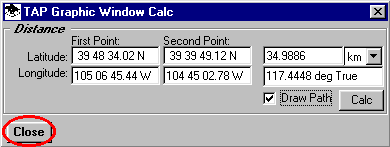
Click the Close button on the Calc form.
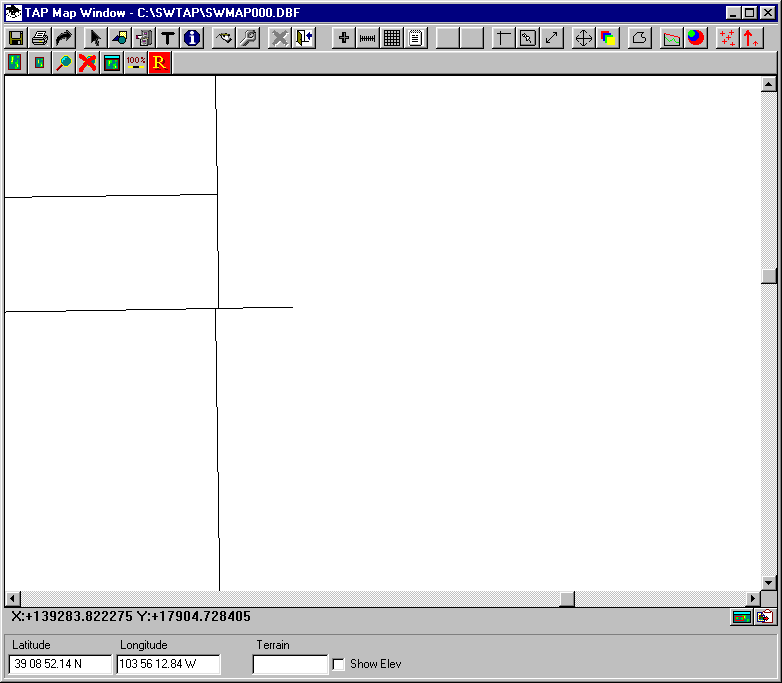
Click on the 100% button to restore the drawing to the original scale.
If the drawing is not completely displayed (depending on the state of the zoom before returning to 100%) click the R (Refresh) button.
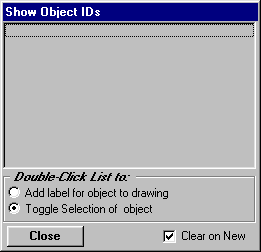
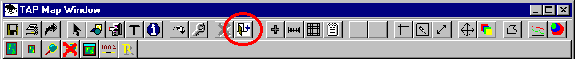
On the Map Window Toolbar, click the ID button
The Show Object Ids form will be displayed. While this form is displayed you can click on the Map Window and information about the object(s) encompassing the point you click will be displayed:
Click on the Map Window, for example, in a county as shown:
When you click on the drawing, the Secondary ID (typically the name) of the object will be displayed. If the point you click is in more than one object (such as a ZIP code, county, and coverage contour on the map) the ID of all the objects will be displayed. (Any time the program is asking you to click on the drawing for input, if you change your mind - e.g., you don’t want to ID any objects - click the right mouse button to cancel the operation.)
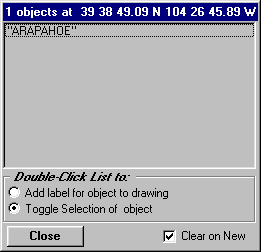
The form shows a list of the object(s) that include the point where you clicked. The two option button at the bottom of the form allow you to manipulate any of the objects in the list.
You can mark the "Add label for object to drawing" button. When you double-click on an object in the list the program will prompt you for the location where you want to add the label for the object to the drawing.
You can mark the "Toggle selection of object" button. When you double-click on an object in the list the program will toggle the selection state of the object. (If the object is already selected it will be deselected. If it is not selected it will be selected.)
This ID function is useful for identifying boundaries as in this tutorial ("Which county is that?") without drawing labels for every object, which can clutter the drawing. The ID function can also be used to identify field strength levels in contour or threshold plots.
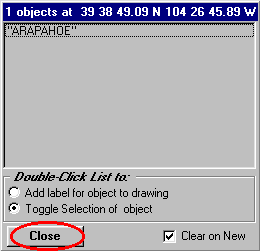
Click the Close button on the Show Object IDs form.
Click the Close button on the TAP Map Window Toolbar to close the Map Window.
Copyright 2000 by SoftWright LLC