Q: How do I show coverage information on the TAP Map Window?
A: You can plot a coverage map from the File menu in TAP by selecting "New Map."
(If you are using TAP 5 you also have the option of using the HDMapper™ mapping function.)
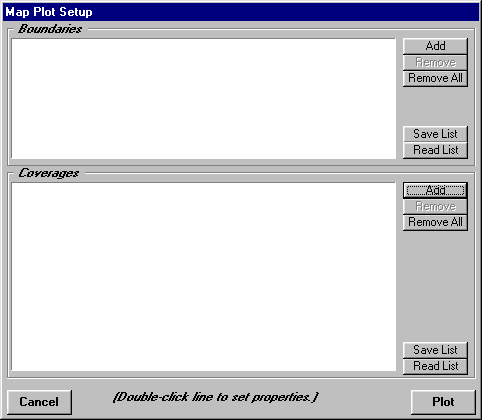
When you use the File menu and select "New Map", or, if a Map Window plot is already displayed, and you click the "Add" button, the Map Plot Setup form is displayed.
The boundary information files (county lines, roads, cities, etc.) are specified in the top portion of the form, and coverage information (field strength thresholds, contours, shadow maps, etc.) are specified in the lower part of the form.
To add a coverage to the list to be plotted, click the Add button in the Coverages section. This will open the Select TAP Task form.
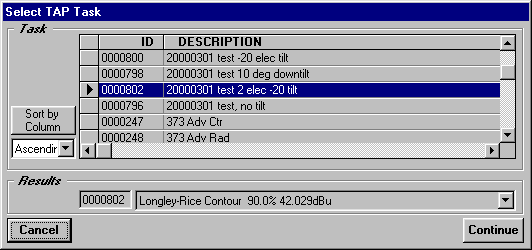
This form lists the Task ID and Description for the coverage study tasks (contours, radial, and tile studies) you have completed that are available to plot. Normally the last task you ran will be highlighted as shown above.
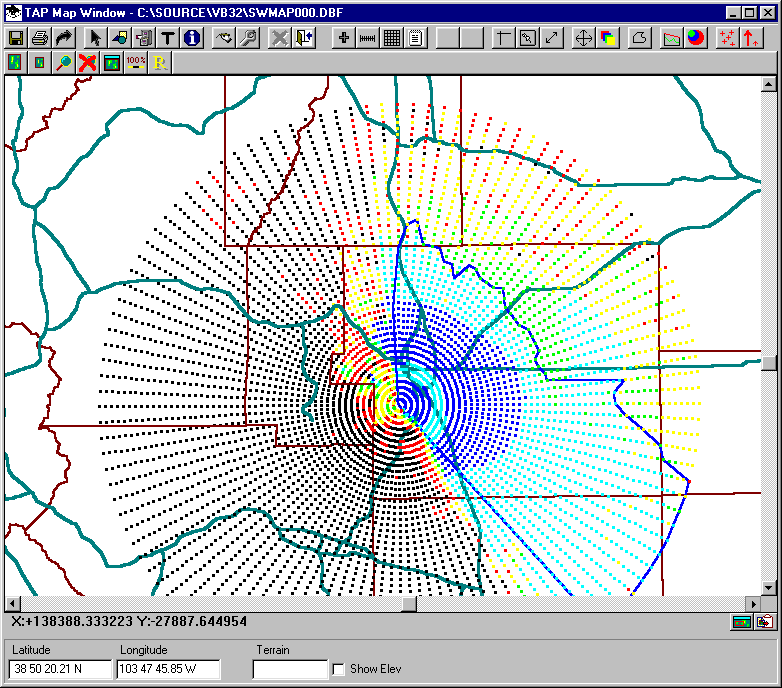
To select the highlighted task click the Continue button. The task will be added to the Coverages list to be plotted:
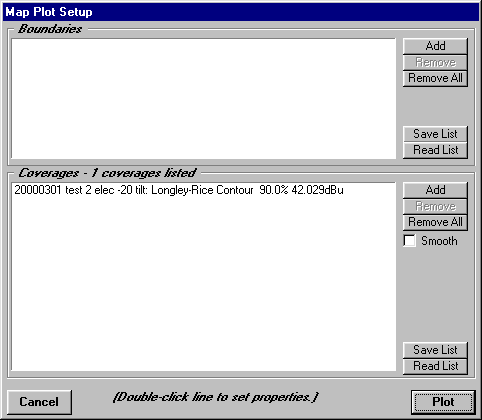
You can click the Add button to add more coverages to the list. Several other features of the Select TAP Task form are important.
On the Select TAP Task form you can also select a column and click the Sort by Column button to arrange the tasks to make a particular task easier to find.
Some tasks can contain more than one type of study.
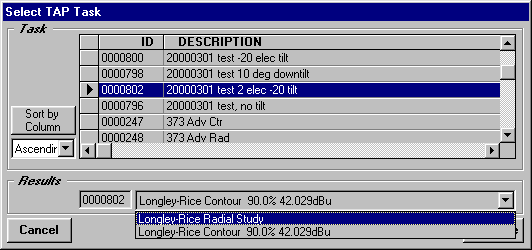
In the illustration shown, the selected task (ID 0000802) actually contains a radial study and a contour. (For most propagation models, computing a contour includes a calculation of field strength values along radials from the site, and the contour is interpolated from the radials.)
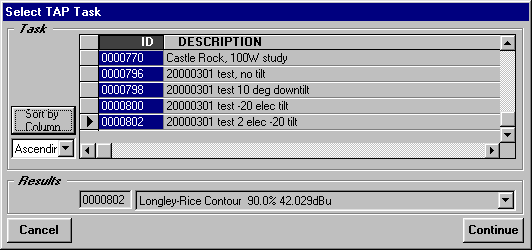
In the pulldown list at the bottom of the form you can select which of the studies contained in the task are to be plotted. For example, in addition to the contour selected above, you could also select the radial study and click Continue to add it to the list:
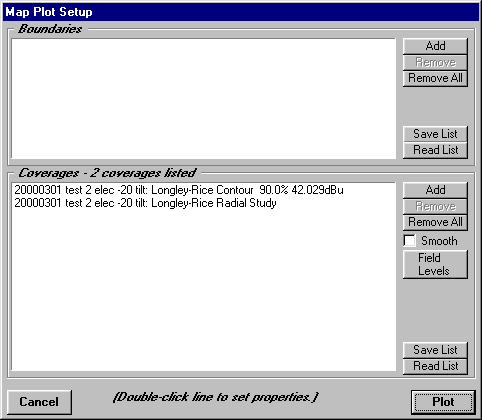
With the coverages you want to plot listed, you can set several parameters regarding the plot.
If any of the coverages are contours, the "Smooth" button is displayed. Contours interpolated for radials around the transmitter site are normally plotted as straight lines between the radials. If few radials are computed, the "Smooth" option can be checked to interpolate the lines into curves between the radials.
You can change the color and line width used to draw the contour by double-clicking the contour line in the list.
If any of the coverages are field thresholds (radial or tile) , the "Field Levels" button is displayed. This button displays the Levels form.
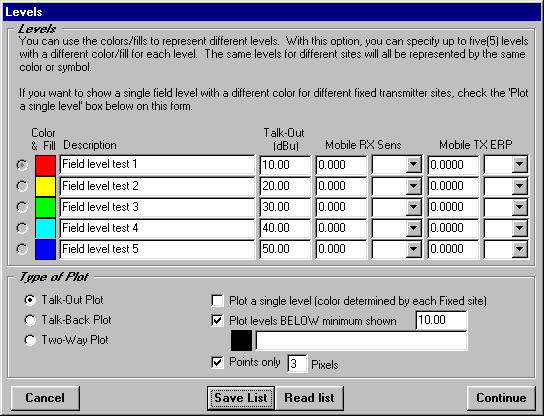
This form enables you to set the field strength levels and corresponding colors, etc., to use for the plot. The use of this form is described in other TAP documentation.
Click the Continue button to return to the TAP Map Setup form.
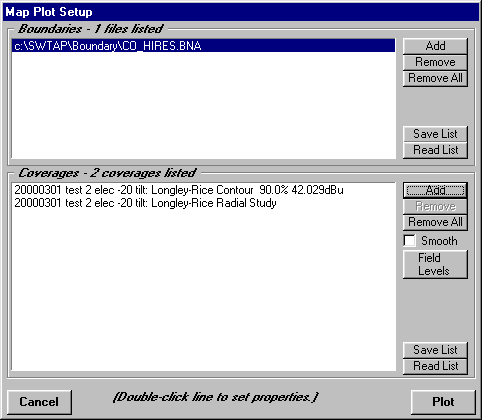
You can also add boundary files for the plot. You can set the color and line width for each boundary file by double-clicking the line in the list.
When you are ready to draw the plot, click the Plot button.
Copyright 2000 by SoftWright LLC