
Q: How can I print out a tabulation of the computed contour distances calculated with TAP?
A: When TAP computes coverage information (a tile, radial, or contour study), the values are written to a database file that is used for plotting the coverage and other functions within TAP, as well as exporting the coverage for plotting in other software.
If you want a tabulation of the values, you can use the Advanced tab on the Coverage Setup form.
Execute the Area Coverage program from the TAP Coverage menu:

On the TAP Area Coverage Setup form, enter the study parameters:
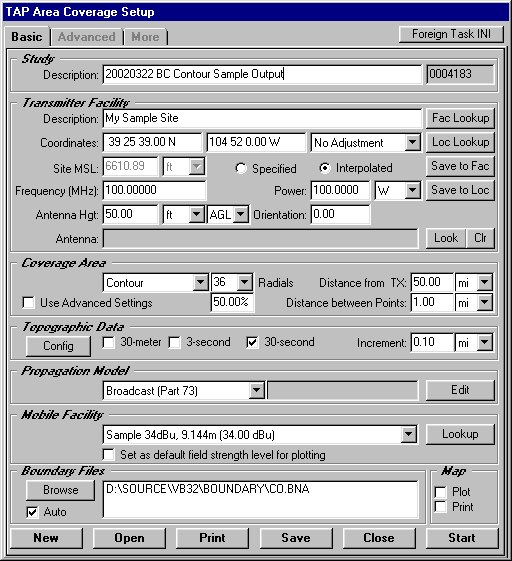
To set the text file output options, you must use the Advanced features for the setup.
Mark the check-box for "Use Advanced Settings":
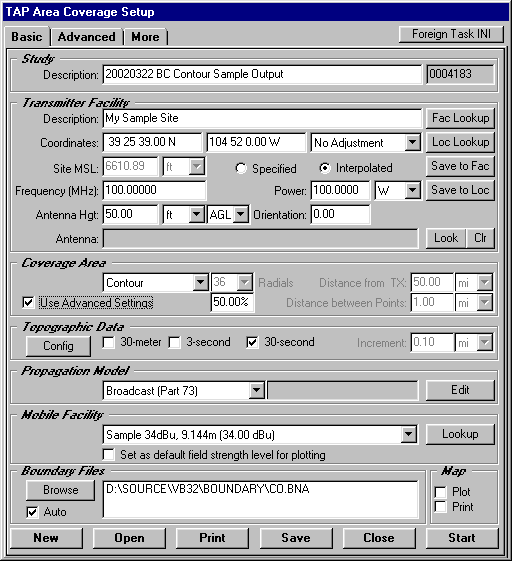
Note that the Advanced and the More tabs which were grayed out have now been enabled.
Click the Advanced tab to display that tab on the form:
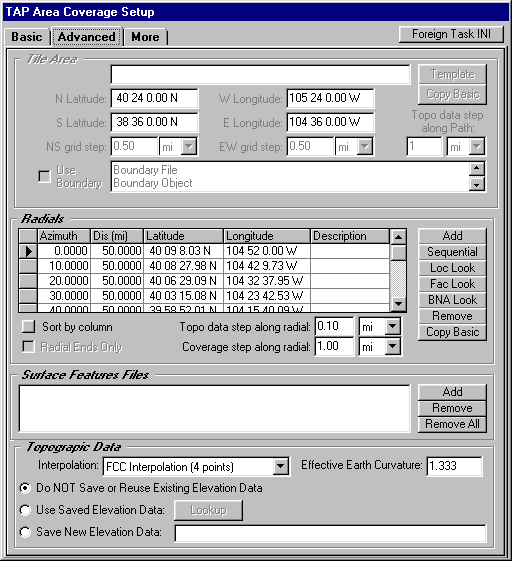
The Advanced and Basic settings are maintained separately in the TAP defaults, so the radial settings (in the center area of the form) may not correspond to the settings you entered on the Basic tab. (The radial parameters will be the values from the last time the Advanced Radial settings were used. If you have not used this setting before, the values may be blank.)
If there are radial values that do not apply to the current study you can remove them from the list. (Naturally, if the radials shown are the ones you want for this study, you do not need to delete them as described below.)
If you want to remove all of the radials, click the selection button to the left of the first row to highlight that row:
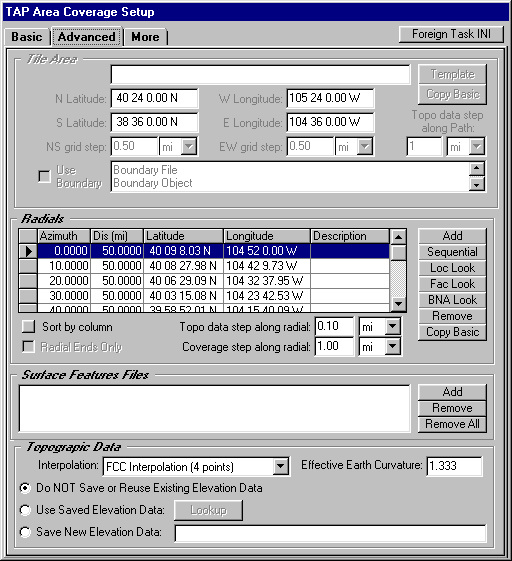
Then scroll to the bottom of the list:
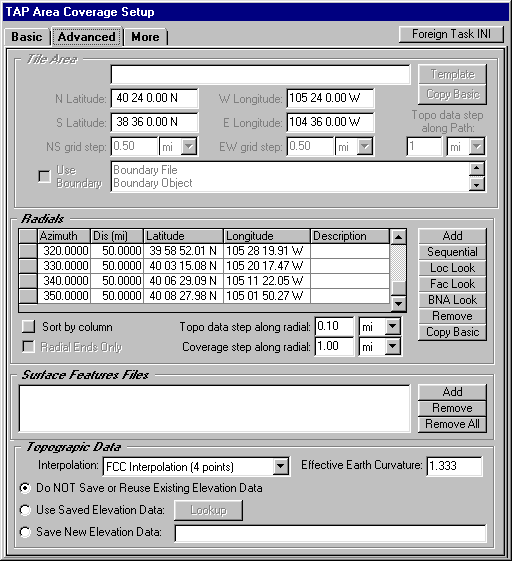
Hold down the Shift key on your keyboard, then click the selection button on the left end of the last row:
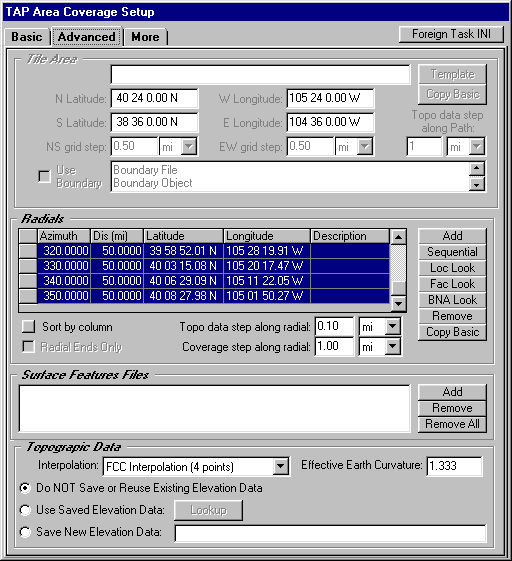
This will select all the records in the list. Then click the Remove button.
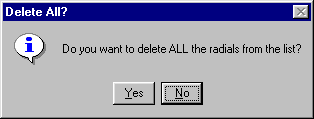
You will be prompted for a confirmation that you want to delete all the records:
The radials will be cleared from the list.
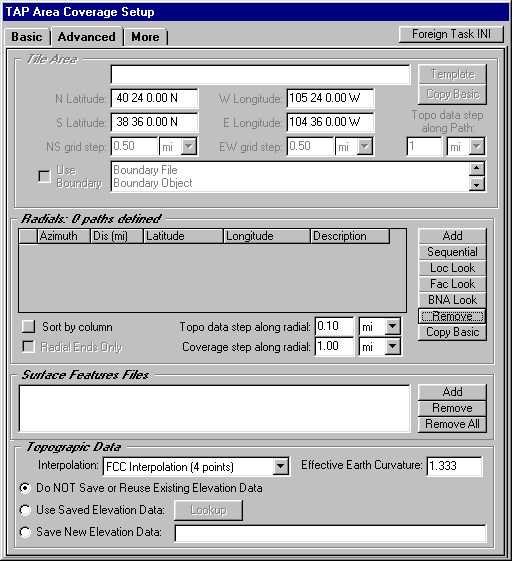
Now you can add individual radials, but in this case you can use the Copy Basic button to create the list of the radials defined on the Basic tab of the form:
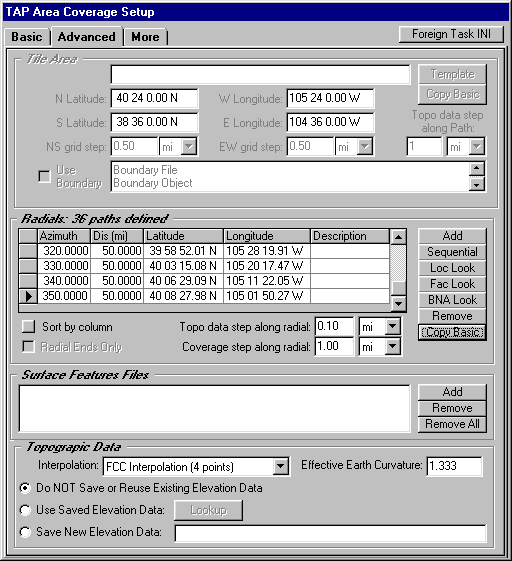
Now that the radials are correctly set on the Advanced tab of the form, click the More tab:
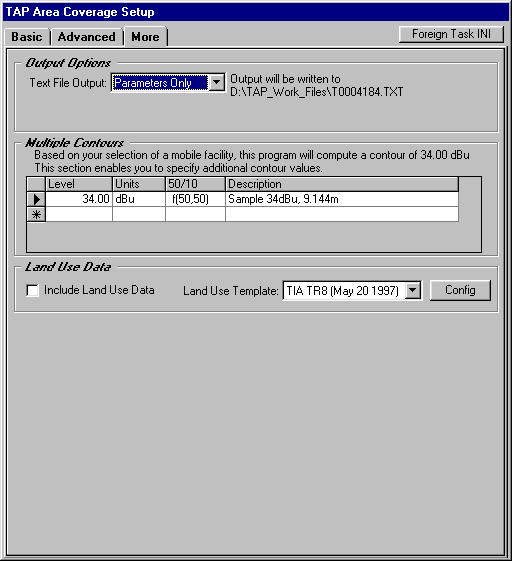
In the Output Options at the top of the form, you have several choices:
For a tabulation of the computed distances for a contour study, select the Computed Value option:
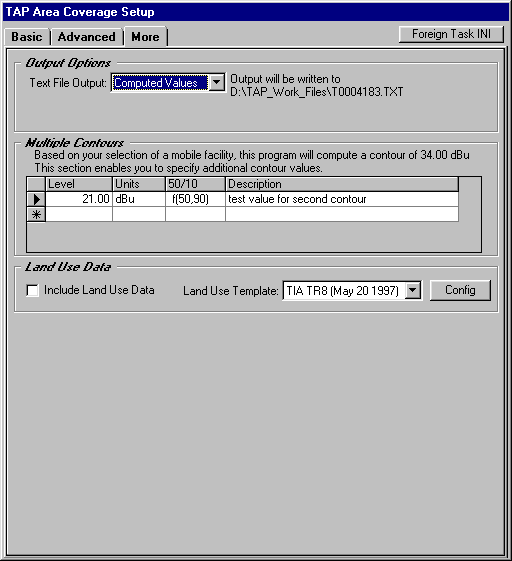
The name of the text file to be written is displayed. The file name will include the Task ID number, such as the example shown: T0004183.TXT, and will be located in the Work folder where other TAP Task files are written.
Click the Basic tab to return to that tab:
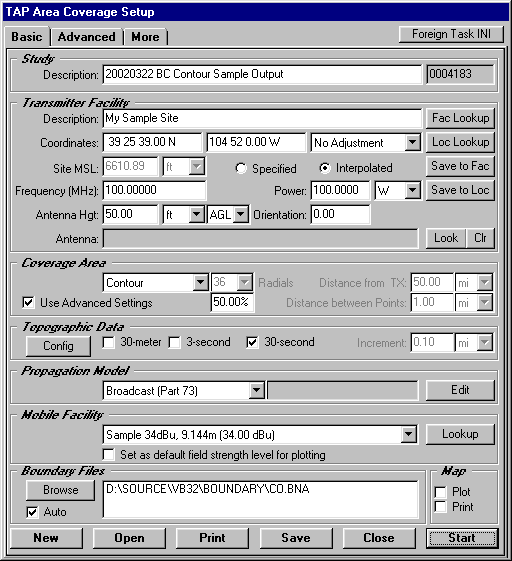
Click the Start button to execute the study.
When the study is completed, you can open the file with Windows Notepad or other text editor or word processor:
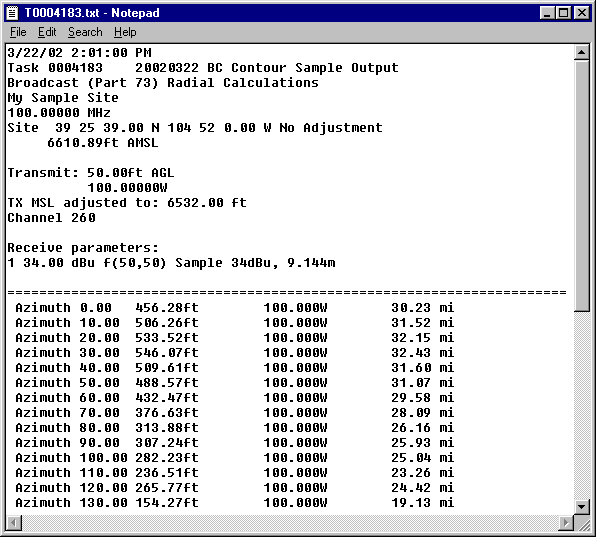
You can use the text file "as is" for a simple tabulation of the values.
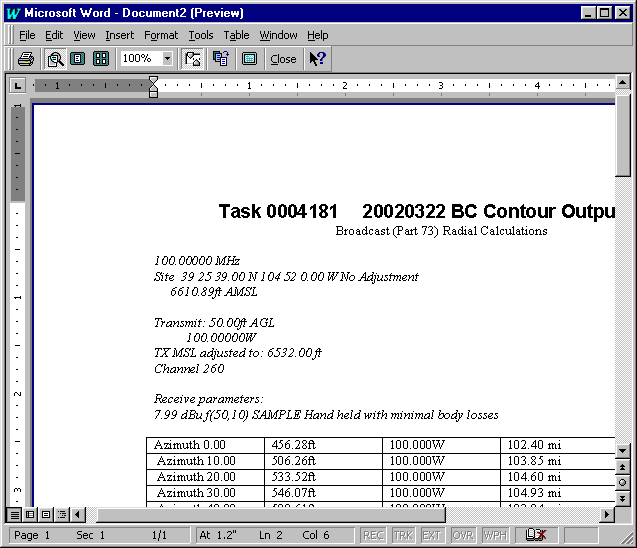
You can also copy and paste the text into a word processor, such as Microsoft Word and convert the tab-delimited columns to a table. You can also use the word processor features to use other fonts, add text, remove unwanted information, etc.
Copyright 2002 by SoftWright LLC