One of the most common questions that we receive is how to import and use clutter and obstructions in TAP propagation studies. In other words, how to account not just for the terrain but also what is on top of the terrain in order to make analyses as realistic as possible. There are several ways to do this in TAP. The best choice depends on the application and the types of data available for the study area.
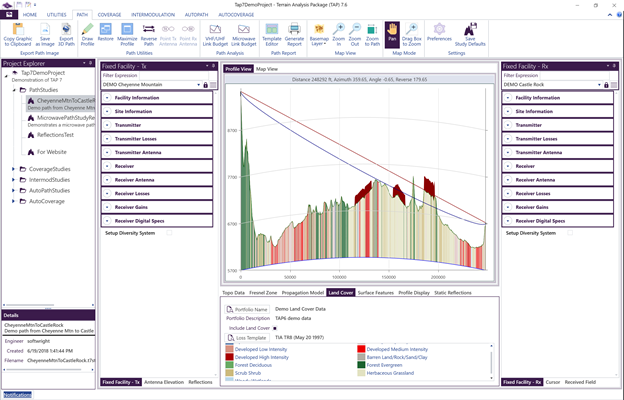
Land Use: Land Use data labels every location as belonging to one of a set of classifications, such as Forest, Agricultural, Urban, Suburban, Grassland, etc. SoftWright has worldwide land use data available for TAP. TAP includes a Land Use Loss Database that correlates the land classification with a loss value as a function of frequency. When TAP is used for an area coverage study or single-point field calculation, the environment of the receiver location can be determined from the Land Use data, and a user-specified loss value can be applied. The Land Use module is required take advantage of this functionality. It is an excellent way to include extra margin for clutter losses when detailed building and obstruction models are not available in the study area. In the figure below, the Land Use category is shown graphically as filled colored bars at every point along an RF path.
Surface Features: In TAP, Surface Features may be used to add height to the terrain due to natural (e.g., foliage and vegetation) and manmade obstructions. Surface features are useful when assessing coverage in a large area of trees or buildings of approximately uniform height. Built-in editors allow users to easily create surface feature files that define areas of known obstructions for inclusion in TAP studies.
Buildings: Many studies are made more accurate by the inclusion of 3D buildings. A widespread global database of 3D buildings is available from Open Street Maps (OSM). However, it does not include every building or other structure (water tower, wind turbine, etc.) that may impact RF propagation. TAP can import OSM buildings for an area of interest. The user can also manually enter location and height information for known obstructions not available from OSM. These OSM and manual obstructions may then be saved together in a single shapefile for use TAP studies.

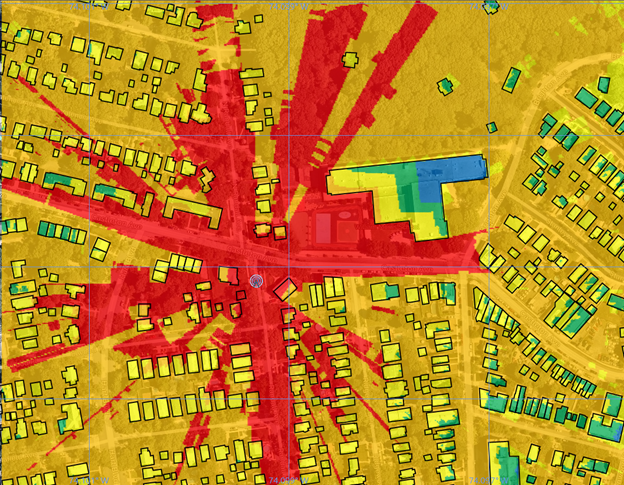
The user can set two loss parameters. The first is a constant Penetration Loss that is applied when a transmitter or a study point falls within a building (i.e., within the building footprint, with an AGL height below the building height) and the path traverses an external wall of the building. The second is a Penetration Loss Rate, expressed in dB per distance unit, that applies a loss according to the depth within the building. An example urban study result is shown in the below figure.