HDSpectrum™ Graphic View
Q: How do I adjust the view of the spectrum graphic in HDSpectrum?
A: HDSpectrum gives you numerous options for changing the way you view the frequency information in your database.
(Note that all values and settings in this article are for illustration purposes only. You should determine the appropriate settings for your application using good engineering judgment.)
When you have an intermod database or intermod study loaded into HDSpectrum, you have several options for adjusting the view of the frequency information in the graphic section of the form.
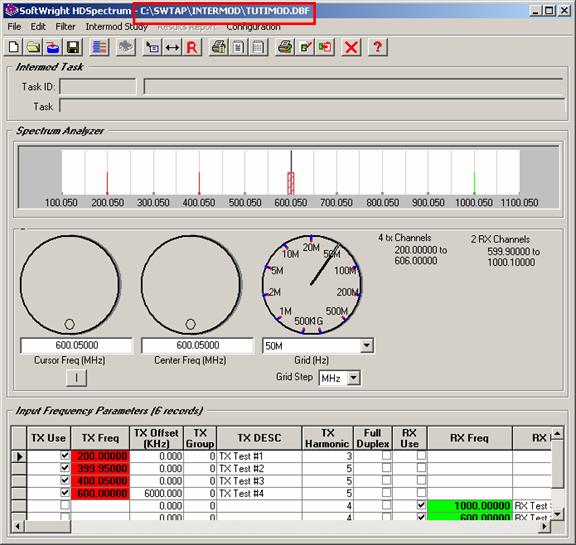
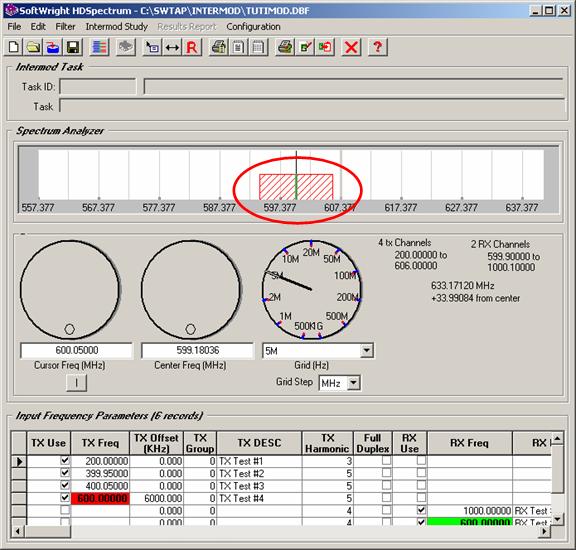
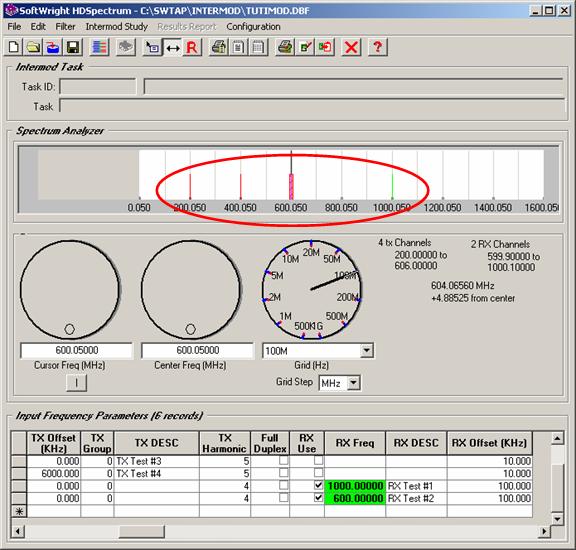
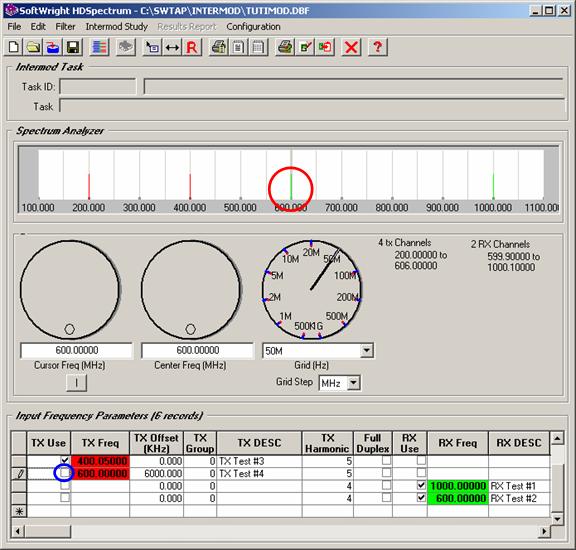
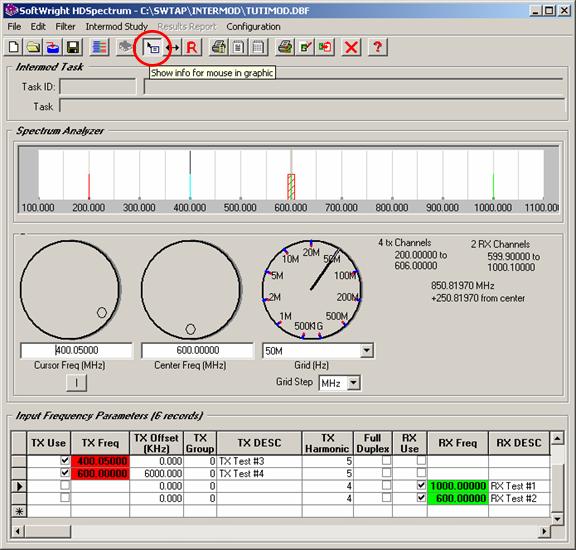
For example, the TUTIMOD file in the INTERMOD folder is a sample database used for intermod tutorial files:
Note several features of the HDSpectrum interface:
The HDSpectrum form contains three sections.
o Intermod Task showing the Task ID and description when you open an intermod study to setup or the results of an intermod study that has already been run
o Spectrum Analyzer showing the graphical representation of the transmitter (TX) and receiver (RX) frequencies, as well as the controls for changing the way the frequencies are displayed.
o Input Frequency Parameters showing the detailed information in the database opened with HDSpectrum.
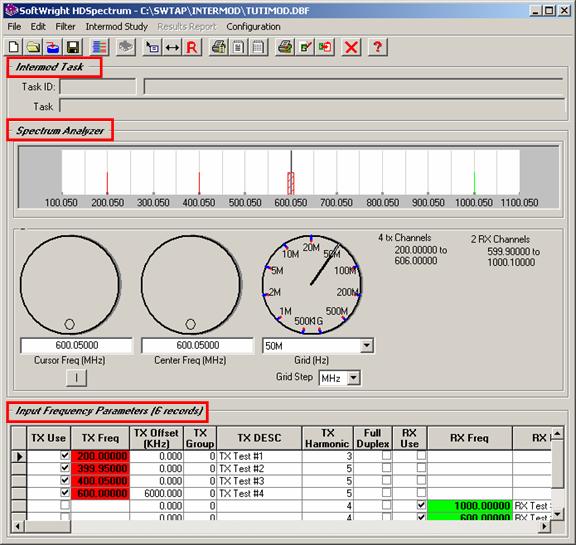
You can collapse and expand each section by clicking the title bar of the section. For example, you can click the “Input Frequency Parameters” title to collapse that section and use more of the available form area for the graphic display:
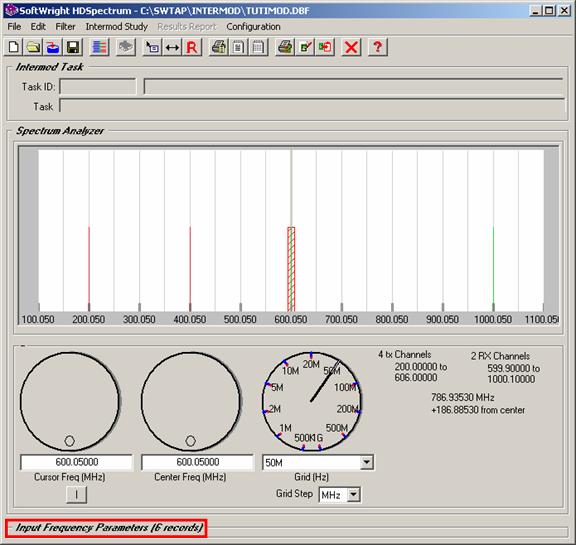
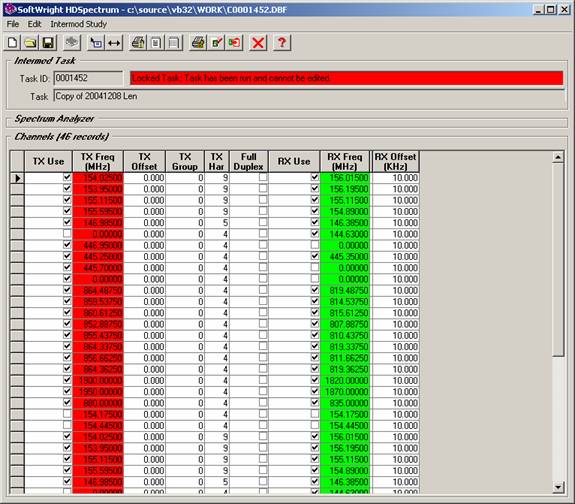
Likewise, if you have a database with many frequencies, you can click the Spectrum Analyzer section to collapse it and display more of the records for editing. (This example image is from a different file, not the TUTIMOD file, to display a list of more frequencies.):
The collapsed sections can be expanded by clicking the title bar again.
Transmit frequencies are displayed in red in the graphic area on the form.
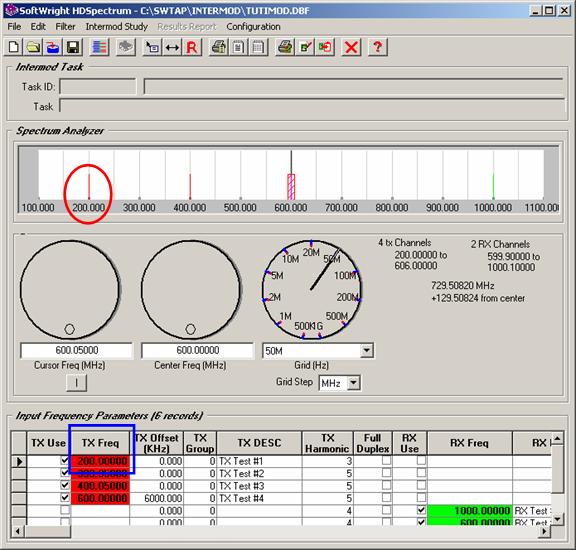
As with previous intermod software in TAP, if the “TX Offset” value for the record is zero, only the center carrier frequency is used in the intermod study. In this case, the frequency is displayed in the graphic area as a single line.
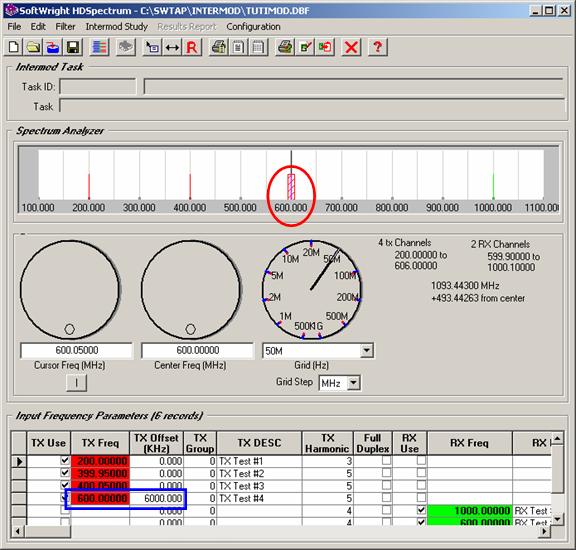
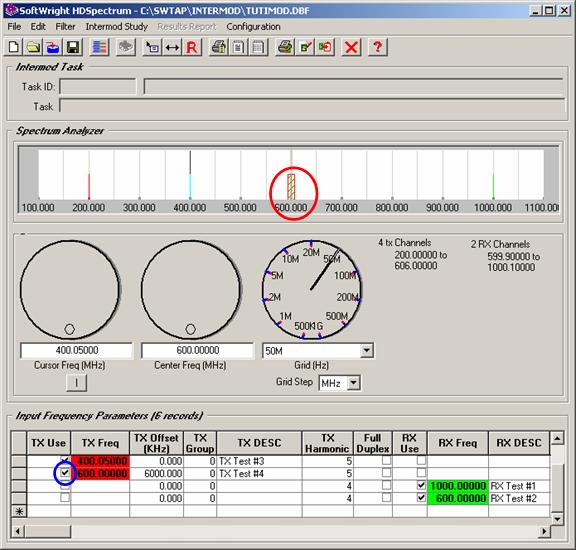
If the TX Offset is set to a non-zero value, the offset is included above and below the center frequency:
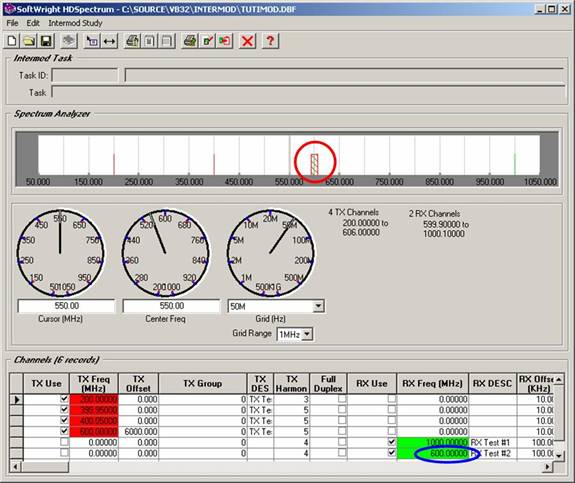
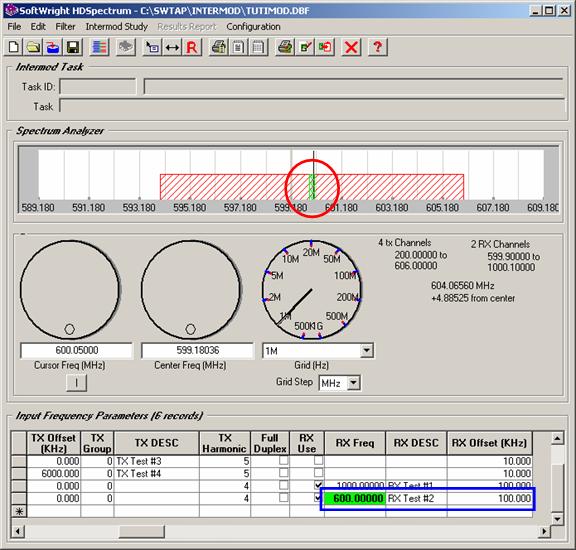
Receive frequencies are shown in green:
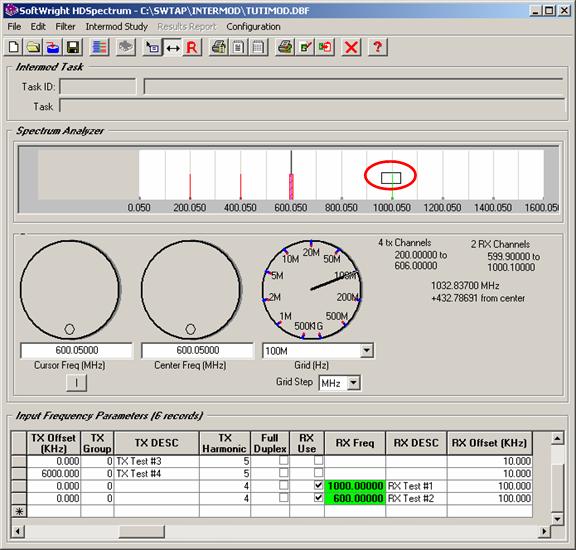
To zoom into a particular part of the graphic, left-click one point and drag a rectangle to define the desired area:
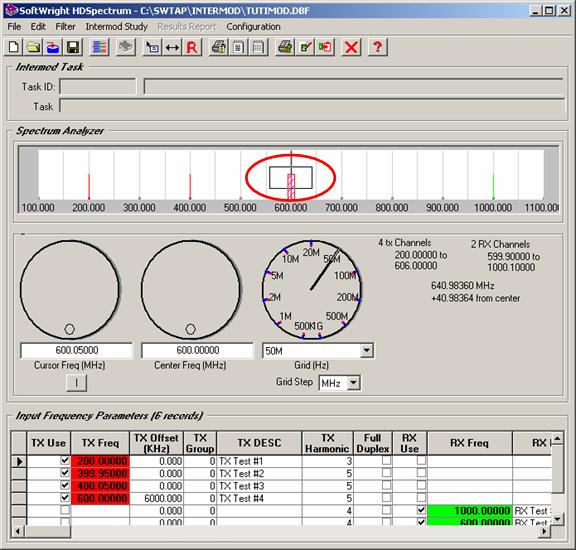
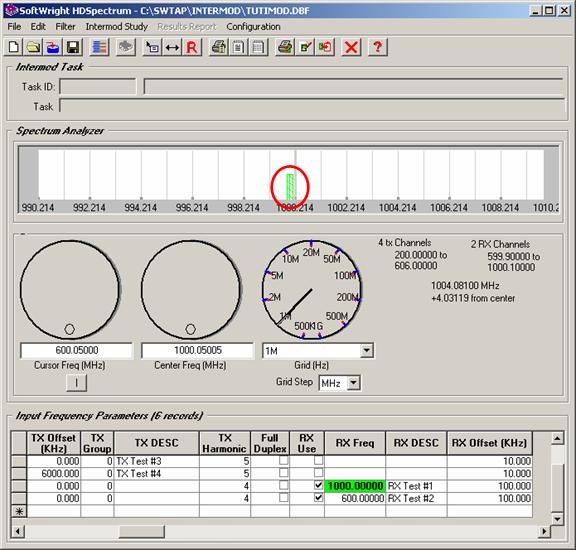
When you release the mouse button, the graphic will be rescaled to the desired frequency range:
(The combination of Center Frequency and the Grid steps may result in the display area being slightly different from the exact area defined with the mouse.)
Note also that the transmit and receive frequencies in the list at the bottom of the form are highlighted only if the frequencies are included in the display range of the graphic.
Receive frequencies are also shown with the offset value above and below the center frequency:
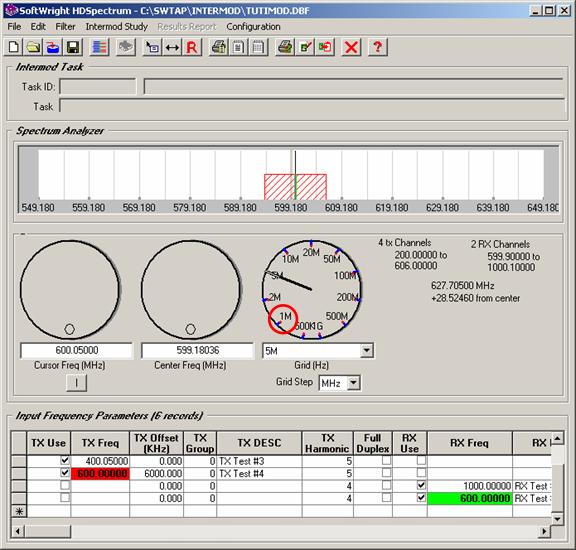
You can change the Grid step on the graphic to expand or contract the display. You can use the pulldown list to select a grid step, or you can drag the pointer on the Grid knob to the desired value:
You can restore the view of all the frequencies with the
“Show All” button ![]() on
the toolbar:
on
the toolbar:
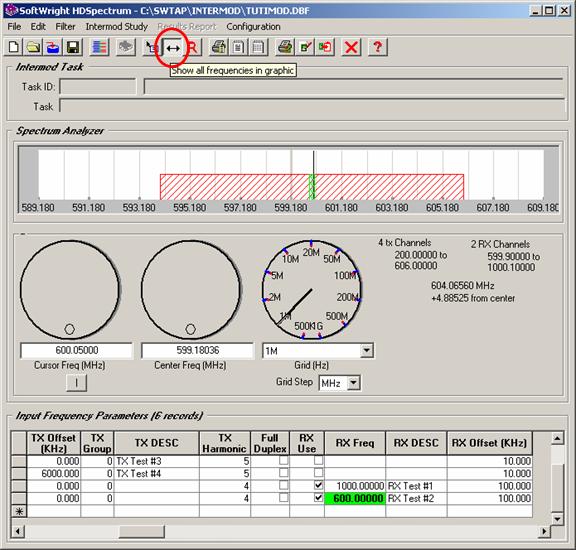
When you click the “Show All” button, the frequency range is expanded to show all frequencies in the list:
Note that the “Show All” button remains pressed. If you click the “Show All” button again to release it, the previous frequency scale is restored:
When the “Show All” button is in the pressed state, you can draw a box on the graphic (as described above) to set a new frequency range:
The “Show All” button is released when the range is changed:
The “TX Use” and “RX Use” check boxes are used when setting up an intermod study to determine whether or not the frequency will be included in the study. The check boxes are also used to control which frequencies are displayed in the HDSpectrum graphic. For example, if we return to the “Show All” state, all the frequecies are shown:
Un-checking one of the transmit frequencies removes that frequency from the display:
You can display a cursor at a desired frequency using the cursor knob. You can type the desired value. (The value is applied when you press the Enter or Tab keys on your keyboard.) You can also drag the knob pointer to the desired value:
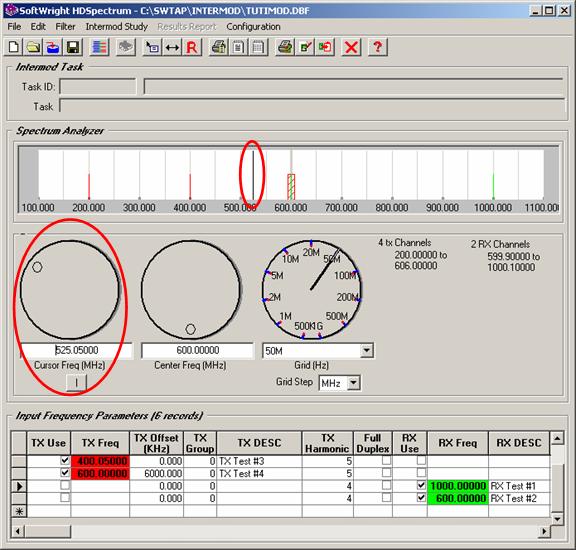
The button below the Cursor dial can be used to force the cursor to the center frequency of the display:
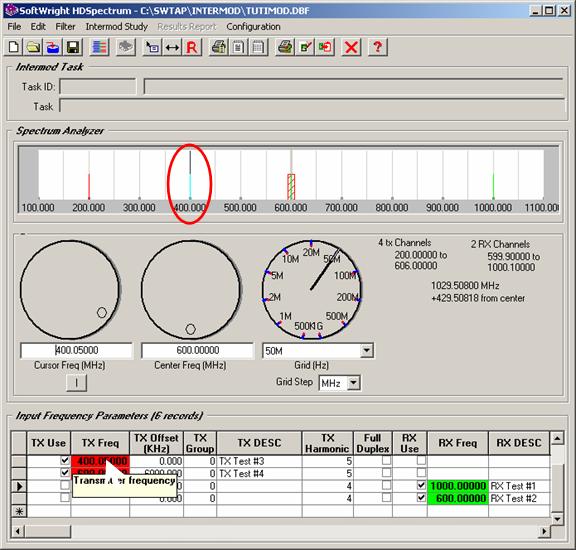
The cursor also moves when you place the mouse cursor over a highlighted transmit or receive frequency in the Input Frequency Parameters list:
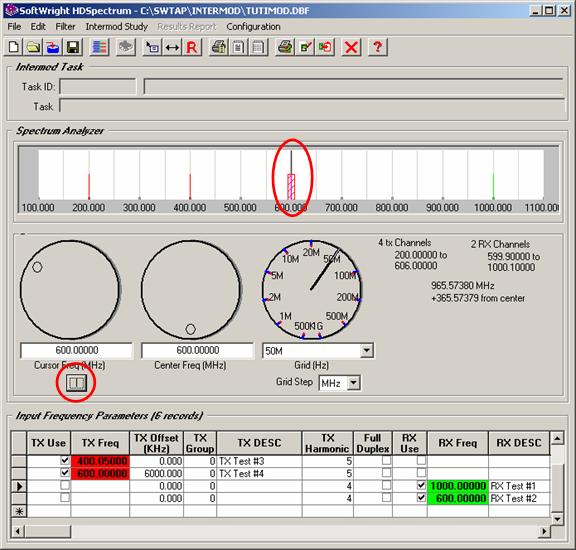
You can display information about the frequencies in the
display at the location of the mouse cursor (not the HDSpectrum cursor
described above) using the “Mouse Info” button ![]() on the toolbar:
on the toolbar:
When the “Mouse Info” button is pressed, the Mouse Information window is displayed. As you move the mouse in the graphic window, the information on the frequencies at the mouse location are displayed:
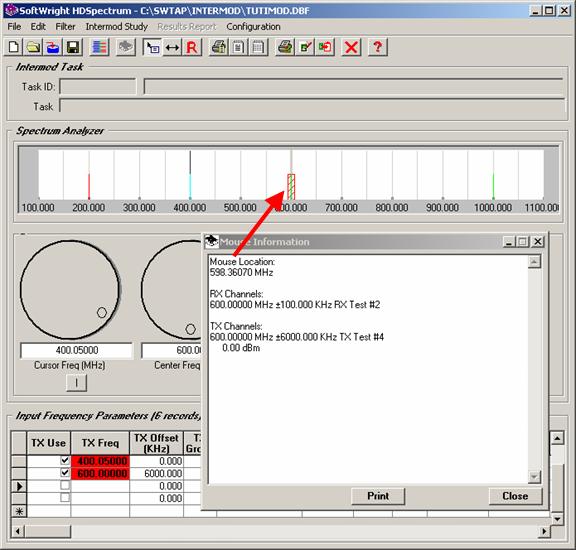
(Note that because of the graphic resolution on different monitors, the exact frequency value of the mouse cursor location may be approximated.)
|
|
Copyright 2006 by SoftWright LLC