Intermodulation Study Reports
Q: How do I print a report with the results of an intermodulation study in HDSpectrum?
A: With TAP6.0.2253 or later you can use the “Print Report” option in the Results Report menu.
Note that all values in this example are for demonstration purposes only. You should determine appropriate settings for your application.
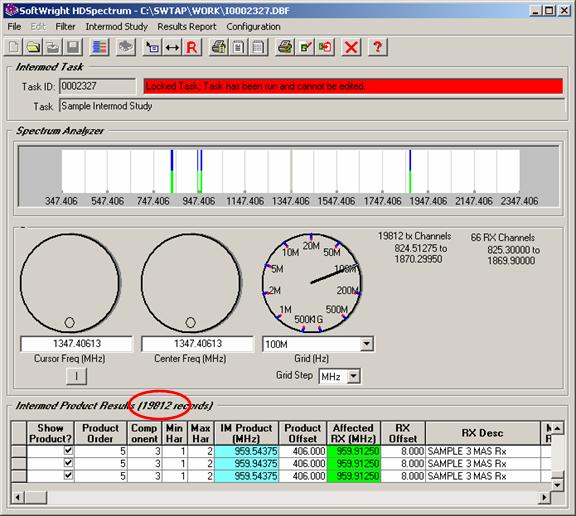
For example, suppose you have run a study as described in the Intermod Results article and you have the complete results of that study displayed in HDSpectrum:
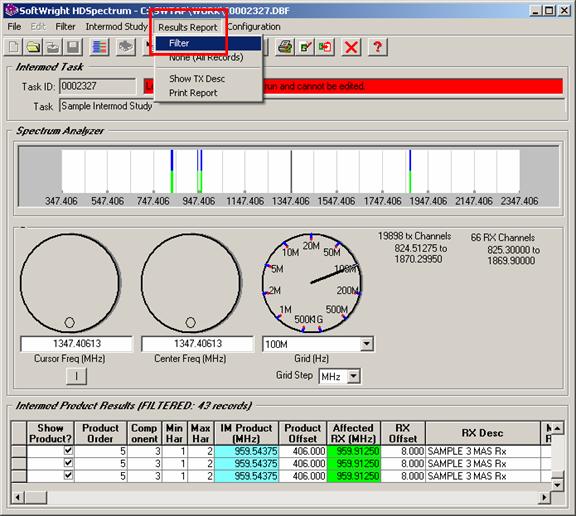
Since the study contains a large number of potential intermod products, you may want to use the Report Filtering function as described in the Intermod Results article:
In this example, suppose you want to look at only those intermodulation products in a particular frequency range:
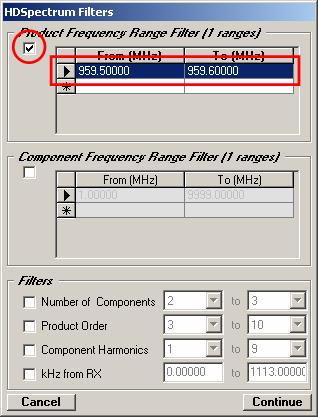
(The other Report Filter capabilities are described in the Intermod Results article.)
For this example, the filter reduces the number of intermod products we are interested in to a much lower number:

You can use the listing of intermod products at the bottom of the form, and the graphic display of the intermod products as described in the Intermod Results article. You can also print the results from the Results Report menu:
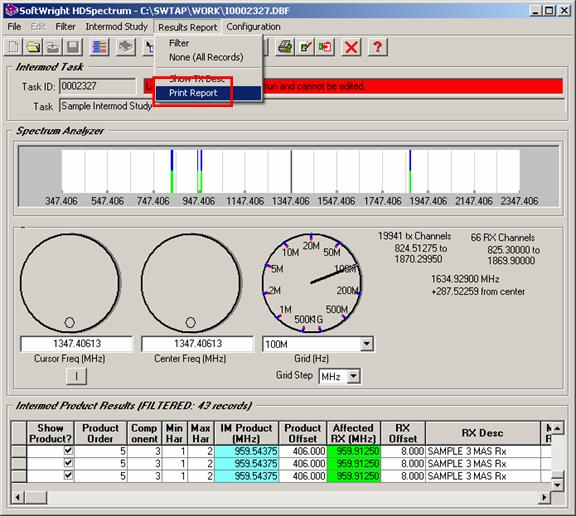
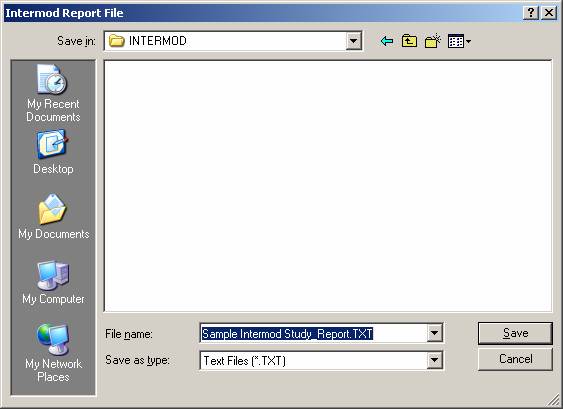
You will be prompted for a file name to use to write the report to a text file. The default file name is created from the Task Description for the study. Enter the file name you want to use and click the Save button.
The Print Report function writes the intermod results to a text file that you can print, edit, etc. If you have applied any filter functions to the results, the filter parameters are included:
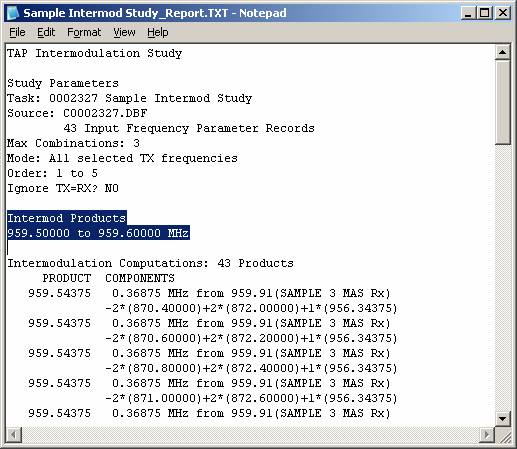
By default, the report contains the following information:
959.54375 0.36875 MHz from 959.91(SAMPLE 3 MAS Rx)
-2*(870.40000)+2*(872.00000)+1*(956.34375)
The computed frequency of the potential intermod product.
959.54375 0.36875 MHz from 959.91(SAMPLE 3 MAS Rx)
-2*(870.40000)+2*(872.00000)+1*(956.34375)
The difference between the computed intermod product and the affected receiver frequency.
959.54375 0.36875 MHz from 959.91(SAMPLE 3 MAS Rx)
-2*(870.40000)+2*(872.00000)+1*(956.34375)
The affected receiver frequency (in MHz).
959.54375 0.36875 MHz from 959.91(SAMPLE 3 MAS Rx)
-2*(870.40000)+2*(872.00000)+1*(956.34375)
The description (if any) of the affected receiver.
959.54375 0.36875 MHz from 959.91(SAMPLE 3 MAS Rx)
-2*(870.40000)+2*(872.00000)+1*(956.34375)
The coefficient (the harmonic value) for each component frequency in the intermod product.
959.54375 0.36875 MHz from 959.91(SAMPLE 3 MAS Rx)
-2*(870.40000)+2*(872.00000)+1*(956.34375)
The frequency of each transmitter component in the intermod product.
You also have the option to include transmitter descriptions in the Results Report by marking the “Show TX Desc” menu item.
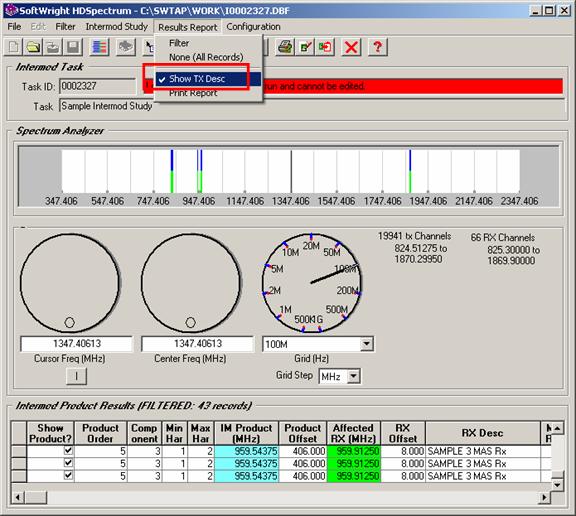
Note that this option adds one to four lines to each intermod product entry in the report and will considerably increase the length of the report.
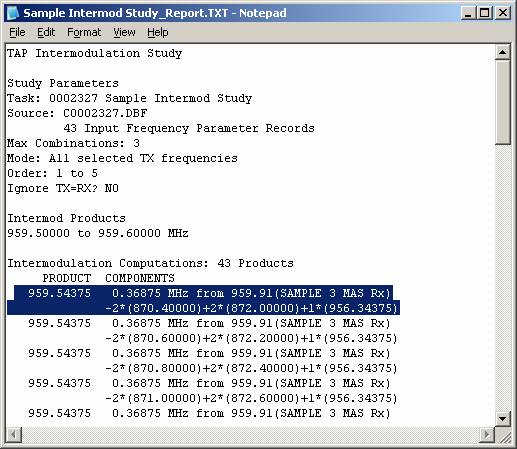
With the “Show TX Desc” option enabled, the description for each transmitter component is added to the listing:
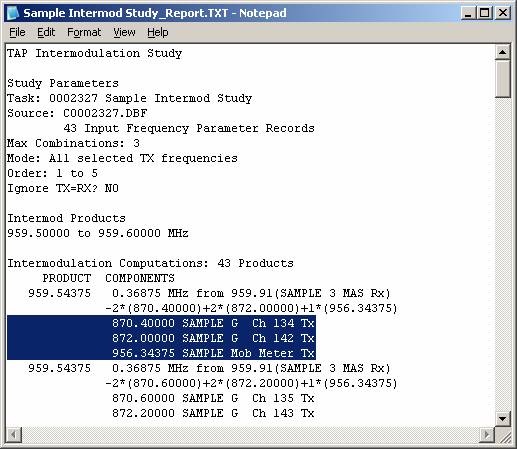
959.54375 0.36875 MHz from 959.91(SAMPLE 3 MAS Rx)
-2*(870.40000)+2*(872.00000)+1*(956.34375)
870.40000 SAMPLE G Ch 134 Tx
872.00000 SAMPLE G Ch 142 Tx
956.34375 SAMPLE Mob Meter
|
|
Copyright 2008 by SoftWright LLC