Contours for Multiple Antenna Heights
Q: How can I determine areas of Line-of-Sight for different antenna elevations, such as aircraft at different flight levels?
A: You can use HDCoverage to set up shadow studies for different mobile antenna elevations, then use HDMapper to plot the multiple desired contours on the same map.
Note that all values in this example are for demonstration purposes only. You should determine appropriate settings for your application.
The Shadow Study module enables you to compute different shadow ratio levels for a specified antenna height. For example, suppose you want to find the areas of Line-of-Sight (LOS) from one of the TAP Demo sites, to multiple elevations, such as an aircraft at 20,000 feet, 25,000 feet, and 30,000 feet above sea level (MSL). This will require three studies, one for each aircraft (Mobile facility) antenna height.
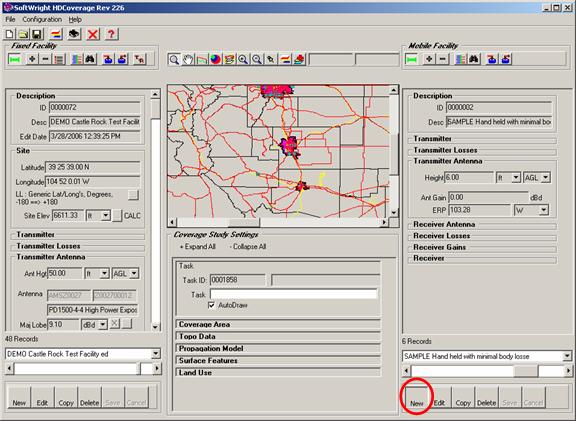
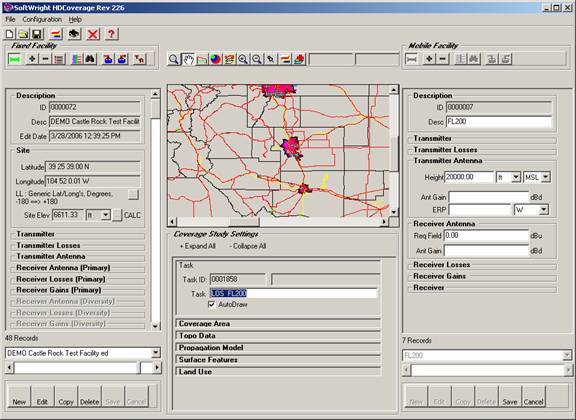
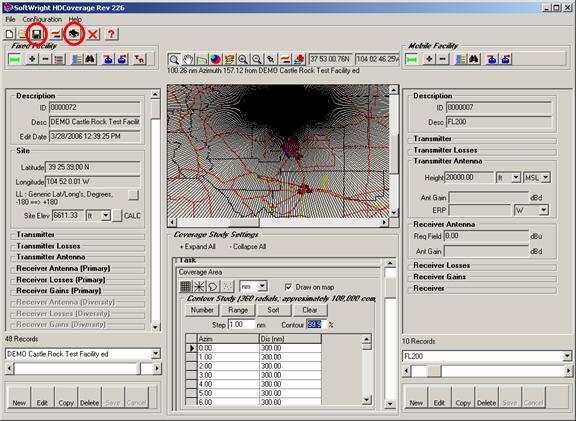
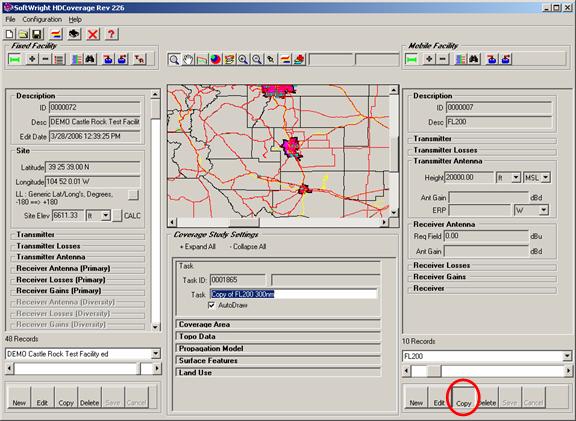
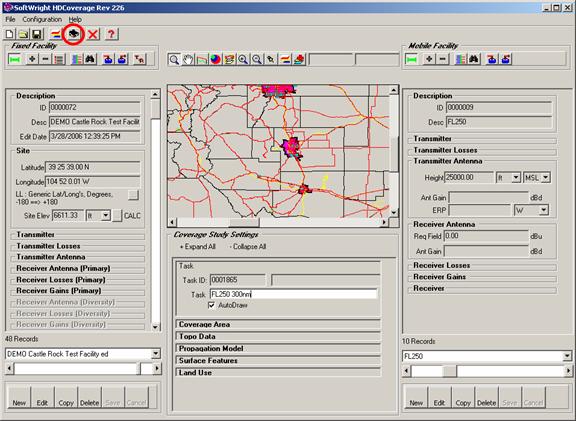
Set up the first study (for 20,000 feet) in HDCoverage by selecting the site you want to use and clicking the New button to create a new study:
If you have not already created a Mobile facility for the desired flight level, click the New button for the Mobile Facility interface to create a new record:
Enter a description and antenna elevation for the new record:
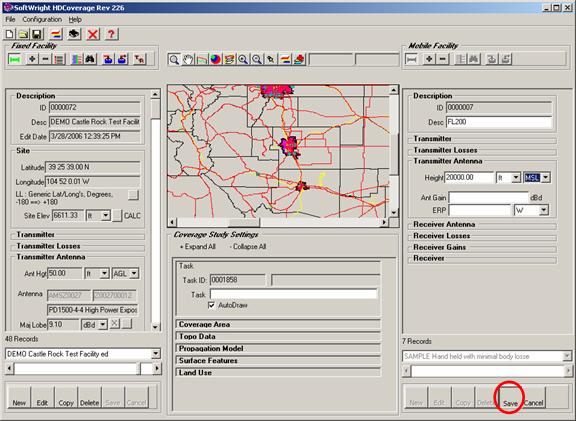
If the desired study is for a constant level flight, be sure the height is specified as MSL (above Mean Sea Level). If you want a study for a constant height above the terrain, select AGL (Above Ground Level). Note that for the Mobile facility, the antenna height for both Transmit and Receive are entered as one value in the Transmitter Antenna “Height” section.
Since this is only for a shadowing study, it is not necessary to enter all the receiver parameters (input threshold, required field level, antenna gain, etc.). If you want to run a similar study to compute actual field strength values, these parameters would also be required.) For this study, simple enter a Required Field Value of 0.00 for the Mobile receiver:
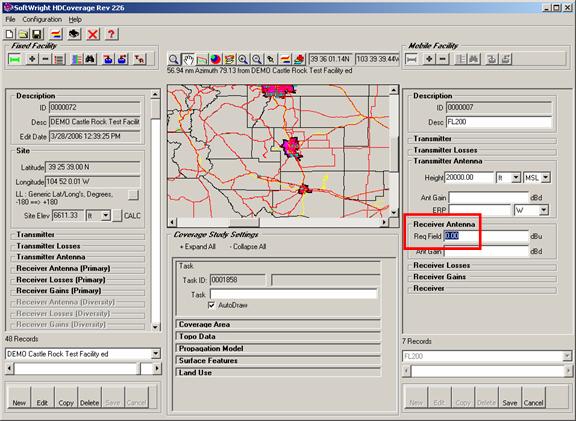
This is not a true “Required Field” since this is only a shadow study. The “Required Field” value, in a shadow study, is interpreted as the shadow ratio to be used. A shadow ratio greater than 0 represents line of sight. (A shadow ratio of less than zero indicates a blocked path. A value greater than 0.5 indicates a clear line of sight and half (0.5) of the first Fresnel zone.) Setting the value to 0.0 results in a contour including values that are zero or greater, representing areas of line of sight.
HDCoverage requires an entry in the Required Field value in order to run the study. Remember to set the receiver input power and other settings that will recomputed the actual required field value if you want to use this Mobile Facility for a field strength study.
Enter a description for the Task:
Be sure the AutoDraw box is checked if you want the results to be displayed in HDMapper when the study is completed.
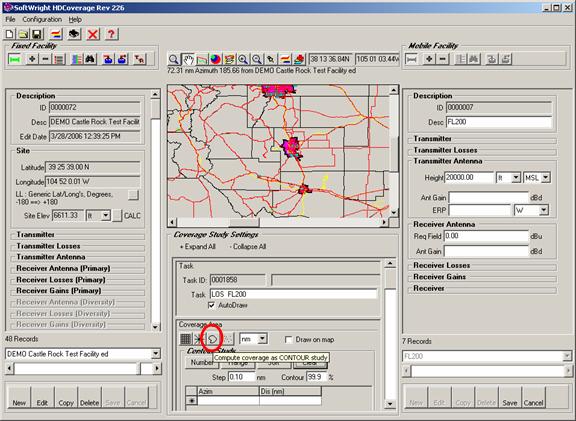
For the coverage area, select a Contour type study:
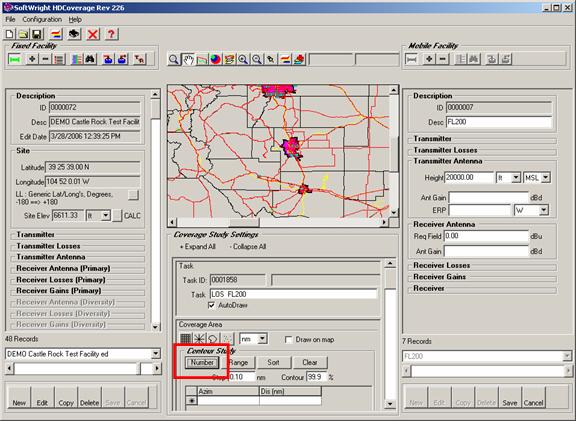
There are several options for defining the radials to use to compute the contour. For this example, click the Number button to specify the number of evenly-spaced radials you want:
You will be prompted for the number of radials to compute. Enter the desired value and click OK.
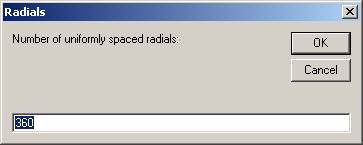
This will compute 360 radials (every one degree). You can enter fewer radials (such as 36, for a radial every 10 degrees) for a less detailed but faster study.
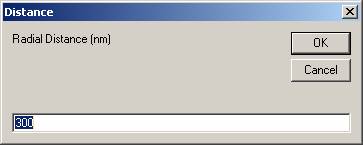
You will be prompted for the distance to use for the length of each radial. The value represents the range of the area of interest for the study. For ground-to-air studies, longer distances (such as 300nm in this example) are typically used. Enter the desired value and click OK.
The radials will be added to the list in the Coverage Area section. If the “Draw on map” box is checked, the radials will be added to the map to show you where the radials will be computed.
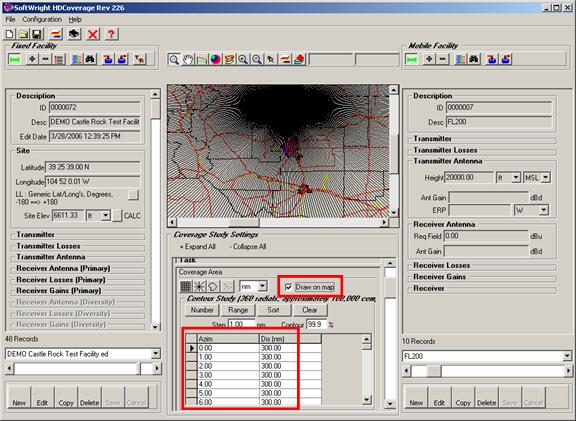
(The default setting for HDCoverage is to only display the map of the state where the Fixed Facility site is located. In cases like this, the coverage area may extend beyond the limits of the map. The values will still be computed when the study is run.)
Enter the “Step” value for the points computed along each radial. For long paths such as this example, you may want to specify a larger step value to define the increment between points.
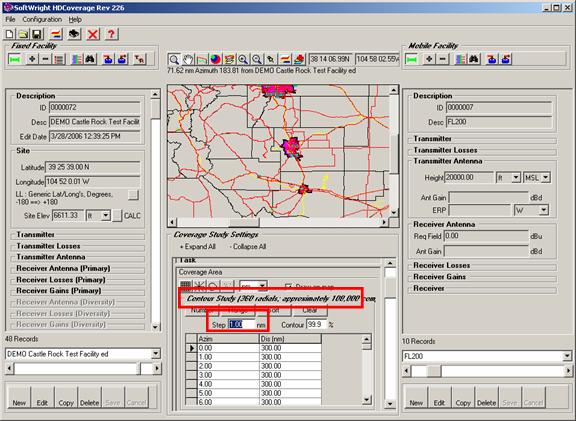
The approximate number of points to be computed is displayed near the top of the Coverage Area section. If you want to change the number of points by recomputing the number of radials or the distance for the radials, you can click the Clear button to remove all the radials in the list, then click the Number button again to create a new set of radials.
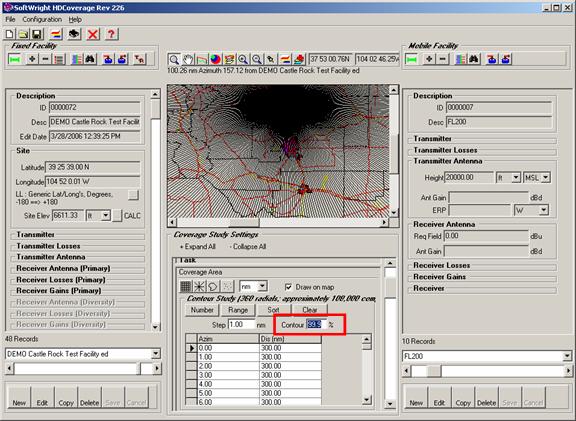
Enter the percent value for the contour. Contour studies are computed by interpolating to find the desired value along the radial, based on the percentage of service desired. In field strength studies, this can typically be values such as 90% or 95%. The result would be a contour defining the area where, for example, 90% of the points inside the contour meet the criterion. That means that up to 10% of the points inside the contour could not meet the desired value. (The interpolation process is described in detail in the article on Contour Interpolation.) For shadow studies you can also enter values in that range, but for this example, we will use the highest permitted value (99.9%) to define the contour where virtually all the points meet the line of sight criterion desired.
When you are ready to run the study, click the Save button to save the settings, then click the Run button to start the study:
When the study is completed, the results will be shown in HDMapper (if the AutoDraw box was checked in the Task section of HDCoverage):
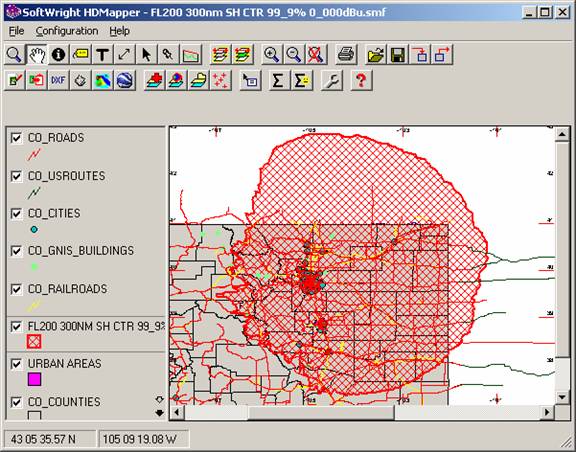
By default, the HDMapper display shows only the shapefiles for the state where the Fixed Facility is located (in the US). You can use the HDMapper functions to add other states as desired.
You can follow the same process in HDCoverage to create two new Mobile Facility records (one for the 25,000 feet MSL study and one for the 30,000 feet MSL study).
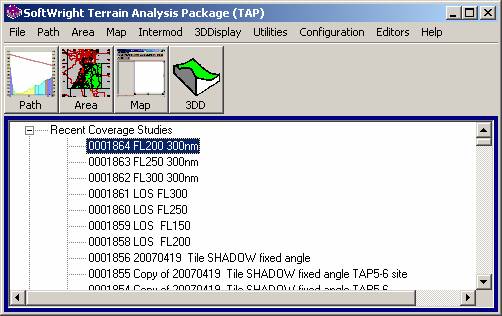
From the TAP6 menu, in the Recent Coverage Studies list, double-click the study for the 20,000 altitude:
When HDCoverage loads the study, the “Locked Task” message will be displayed:
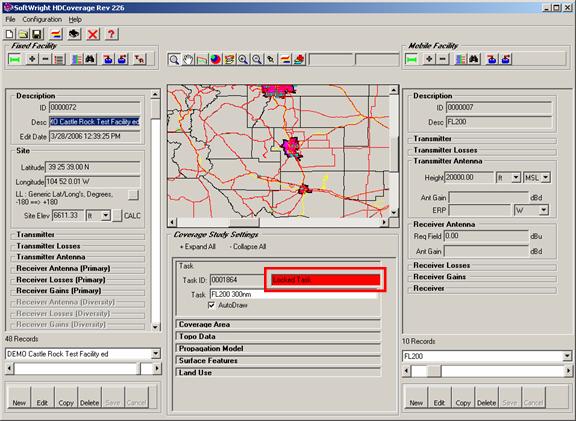
When a Task has been run, it is “Locked” to prevent changes that would cause confusion between the parameters that were used to create the results for the Task.
Click the New button to make a copy of the Task, but with a new Task ID value:
In HDCoverage, select the Mobile facility created for the first study, then use the Copy button to make a copy of the record:
A copy of the record will be made. Change the Antenna Height value in the new record to 25000 feet MSL:
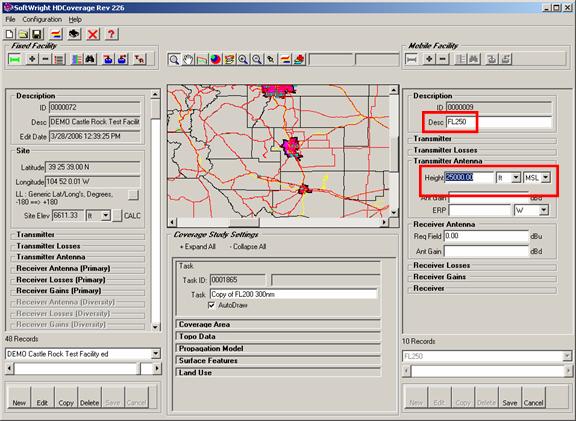
Also be sure to change the Mobile Facility description for the new record. Since this is a copy of the previously used Mobile Facility, no other changes are needed for this sample study.
Click the Save button to save the new Mobile Facility record.
Change the Task Description for the task and click the Save button to save the Task:
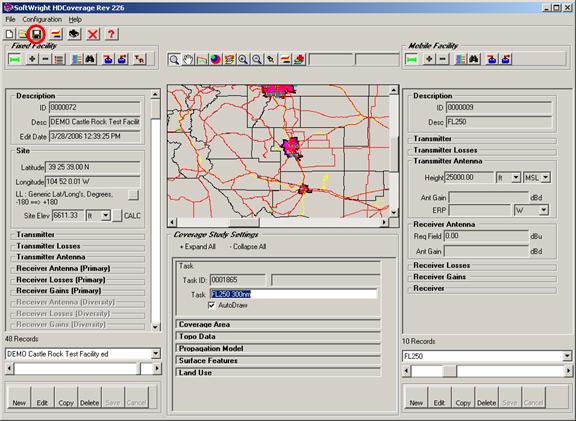
Since this is a copy of the previous Task, no other changes are needed for this study.
Use the same process to create another new Task for the 30,000 feet MSL study, and a new Mobile Facility with the Antenna Height of 30,000.
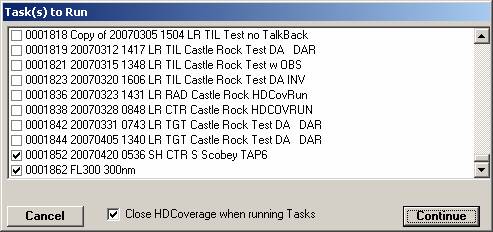
Now that two additional Tasks have been created and saved (for 25,000 and 30,000 feet), click the Run button:
The Task(s) to Run form is displayed. Be sure the two studies you have created are both checked, and click the Continue button to run the studies.
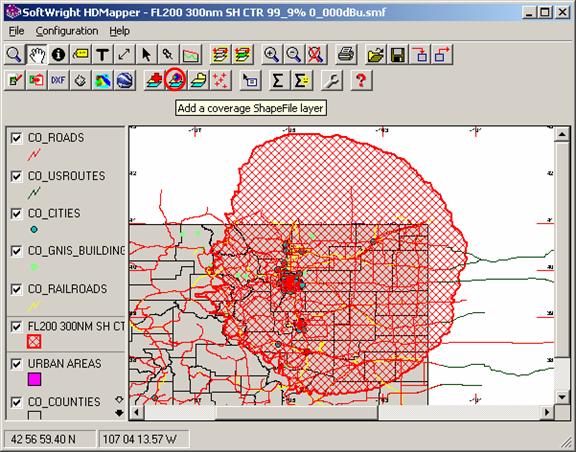
Each of the studies will be displayed in separate instances of HDMapper. Use the Add a Coverage ShapeFile Layer button in HDMapper to add the coverages to a single map:
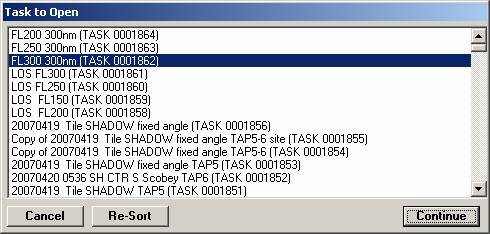
Select the Task results you want to add and click the Continue button:
After added all three contours to the map you can double-click entries in the Legend to change the layer properties:
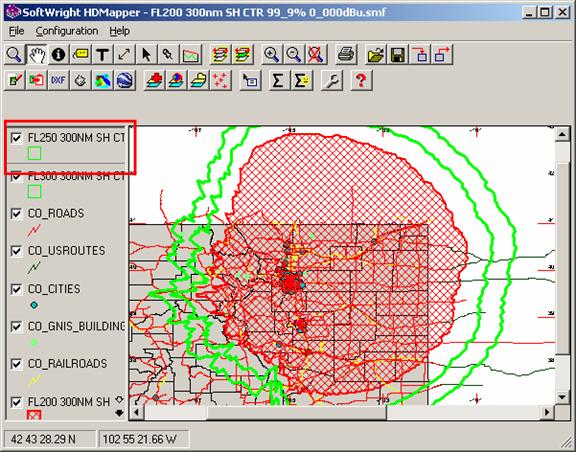
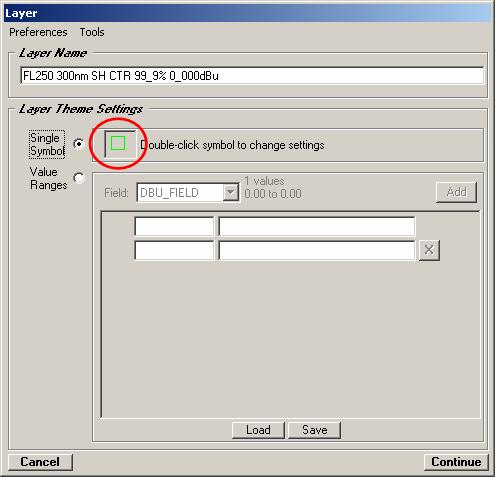
The Layer form will be displayed. Double-click the symbol for the contour color properties:
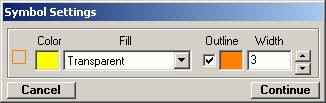
Select the color and line thickness (and fill pattern, if desired) you want to use:
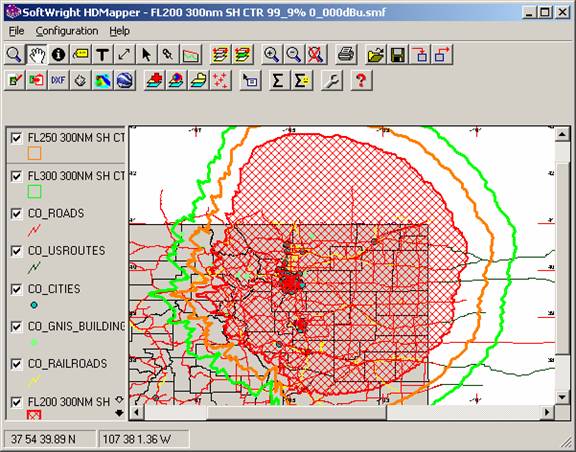
The map will display the changes you make:
You can also change the order of layers and color settings, add or remove layers, show the coverages in Google Earth or 3DDisplay, and other options.
|
|
Copyright 2007 by SoftWright LLC