Ground-to-Air Studies with TAP
Q: How can I compute ground-to-air coverage with TAP?
A: With TAP6 or later you can compute ground-to-air communication using HDCoverage. Ground-to-air studies involve setting up the base station in the TAP Fixed Facility database, setting up the mobile (airborne) station in the TAP Mobile Facility database, selecting the propagation model, and defining the desired coverage area.
Note that all values in this example are for demonstration purposes only. You should determine appropriate settings for your application.
The base station information (coordinates, power, antenna gain and directional pattern, etc.) is entered and saved in the TAP Fixed Facility database, just as in area coverage studies for ground-based mobile units.
The antenna information for the base station is especially important for ground-to-air studies, even for antennas that are omni-directional in the horizontal plane. The elevation pattern of the antenna is particularly important to consider the power that the base station transmits toward aircraft located in different vertical angles from the antenna.
Numerous antenna patterns are provided in sample libraries provided with TAP. You can import specific antennas from manufacturers’ files as needed.
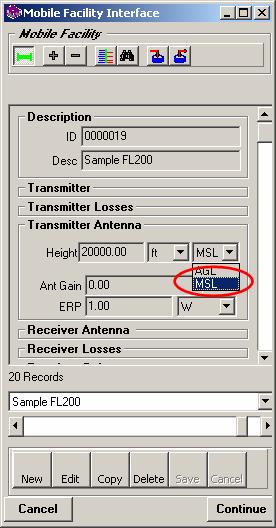
Setting up the mobile airborne station in a ground to air study is similar to a mobile unit in a land-based study using the TAP Mobile Facility database. The main difference is that the antenna height (entered in the Transmitter Antenna value for both the transmit and receive antenna of a mobile unit) is usually entered as the elevation relative to mean sea level (MSL) rather than above ground level (AGL). The antenna elevation reference is selected with a pull-down list in the Mobile Facility database interface:
Using a mobile antenna height specified as MSL assumes a constant flight level at the desired altitude. Using an antenna height specified above ground level (AGL) represents a terrain-following elevation, where the mobile antenna height is a constant height above the varying terrain. Antenna heights specified references to AGL are usually used in land-mobile studies, such as a hand-held radio that is six feet above the ground (6 ft AGL).
In the current version of TAP, only the Bullington propagation model is recommended for ground-to-air studies. Other models (Longley-Rice, Okumura, etc.) have nominal limits on antenna heights that would be exceeded by most airborne mobile units.
The shadowing module in TAP can be used to compute line of sight areas from a base station to airborne mobile units as well.
Ground-to-air coverage can be computed using any of the TAP Coverage Area specifications – tile, radial, contour, or target points.
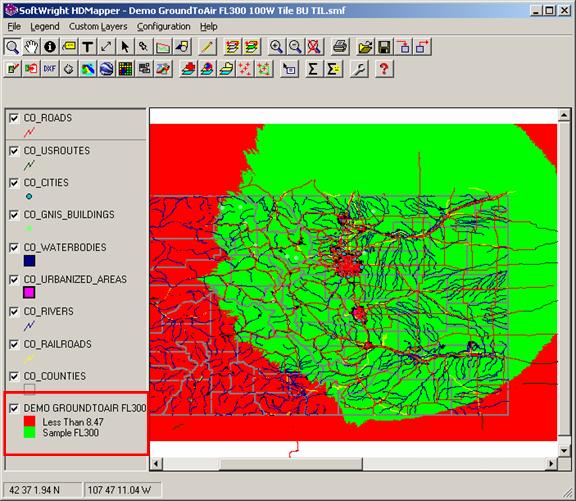
Tile studies show the most uniform and detailed coverage over the entire area. The tile study enables you to display the computed field strength at discrete points over the area. This means that a tile study shows more detail than a contour study. Specifically, a tile study shows areas of coverage that may be outside of a computed contour, as well as areas if inadequate signal for areas that may be inside a predicted contour. However, as with other area coverage studies, tile studies typically take longer to run than the corresponding Radial or Contour studies
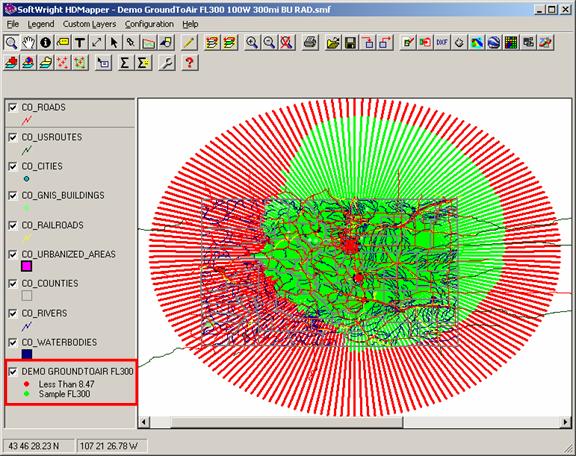
The radial study enables you to display the computed field strength at discrete points over the area. This means that a radial study shows more detail than a contour study. Specifically, a radial study shows areas of coverage that may be outside of a computed contour, as well as areas if inadequate signal for areas that may be inside a predicted contour. As with other area coverage studies, radial studies typically run faster than a corresponding tile study. However, since the field strength calculations are only made along specified radials, the coverage calculations are not as uniformly distributed as for a tile study.
Contour studies are based a values along radials (as in a radial study) but the values are interpolated to define a desired contour value. The interpolation is based on the percentage of points along a radial that provide the desired coverage. For example, if a 90% contour is computed, it is likely that as many as 10% of the locations within the contour
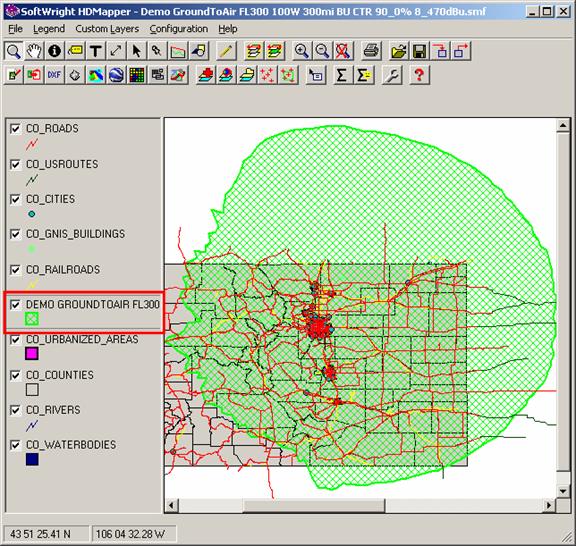
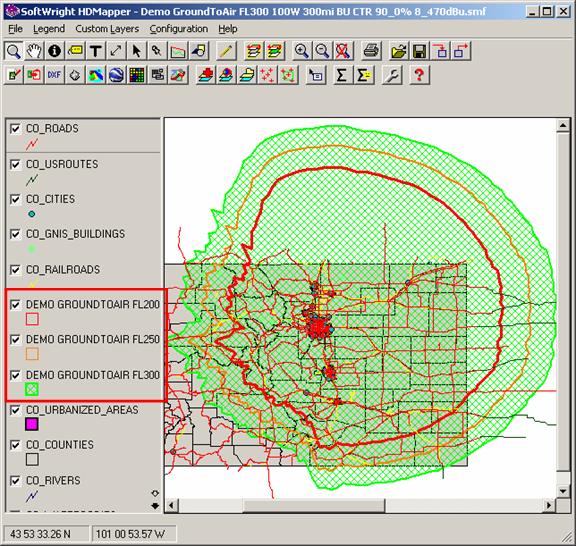
Contour studies can be combined to show coverage areas at different flight levels (represented by different antenna heights above mean sea level in different Mobile Facility records for different studies).
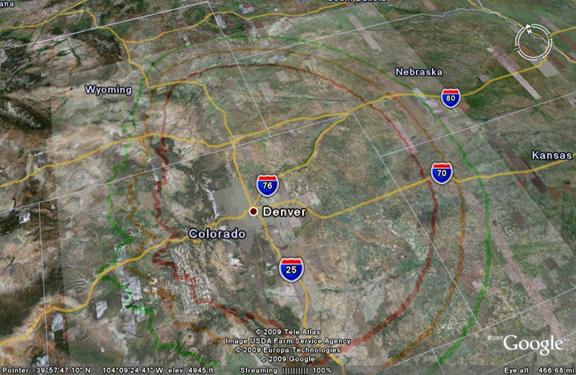
If the 3DDisplay module is licensed to your TAP system, you can export the plotted coverage study (tile, radial, or contours) to Google Earth:
|
|
Copyright 2009 by SoftWright LLC