Q: I computed a large coverage study and when I try to plot it in TAP I get the error "Not enough memory to sort". How do I solve this?
A: The size of the graphics database TAP creates to draw the coverage map may be the problem.
When TAP draws a graphic (coverage map, antenna pattern, or path profile) the program creates a graphic database that is used to construct the drawing. If the size of this file gets much larger than about 100Mb, the program may have trouble processing the drawing.
There are several things you can do.
Points Instead of Boxes
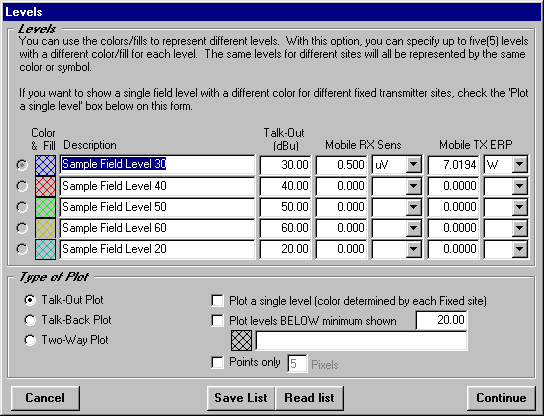
Probably the easiest change is on the Levels form in TAP where you set the field strength (or shadow ratio) levels you want to plot, and what color will represent each level.

On the Levels form (where you set the field levels and colors you want to represent them), there is a check-box near the bottom for "Points only".
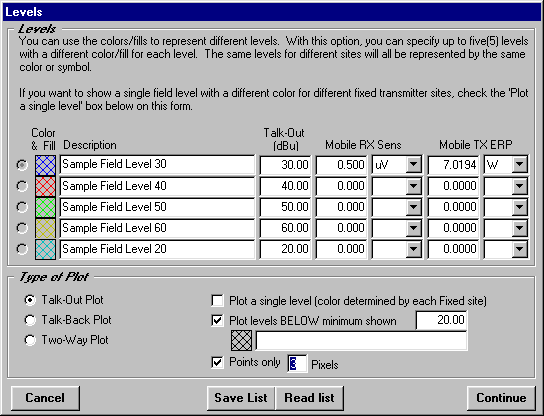
That box tells the program to draw a point (the size in pixels is also specified on the Levels form) instead of the boxes with the cross hatch fill. The point takes one line in the database; the filled box takes at least five. Changing to the Points Only option may solve the problem by reducing the size of the new database created for the plot.
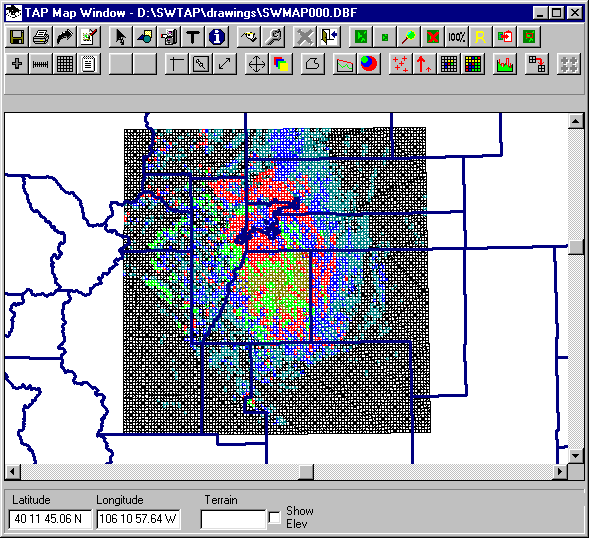
For example, a coverage plotted with filled boxes creates a graphic database of 14.6Mb:
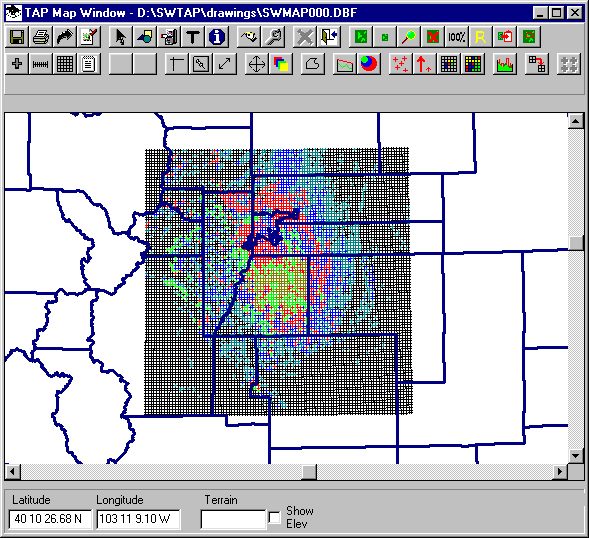
The same study, plotted with the "Points Only" option, creates a 4.3Mb database file, a reduction of about 70%:
Plotting Levels
The Levels form also includes a check box labeled "Plot Levels BELOW minimum".
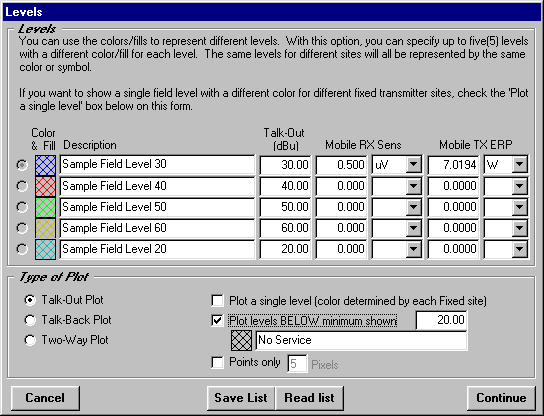
The level values you set in the center part of the form are "this value or greater" levels, so any points below the minimum value you specify would not be shown. The "Plot levels BELOW" option enables you to display all the points that were computed but did not meet the minimum level you specified. (The value shown next to the check box is updated automatically as you change the levels in the main part of the form. It cannot be changed directly.) You can also enter a description as shown, such as "No Service" that will be included if you add a legend to the drawing or the page layout when you print the map.
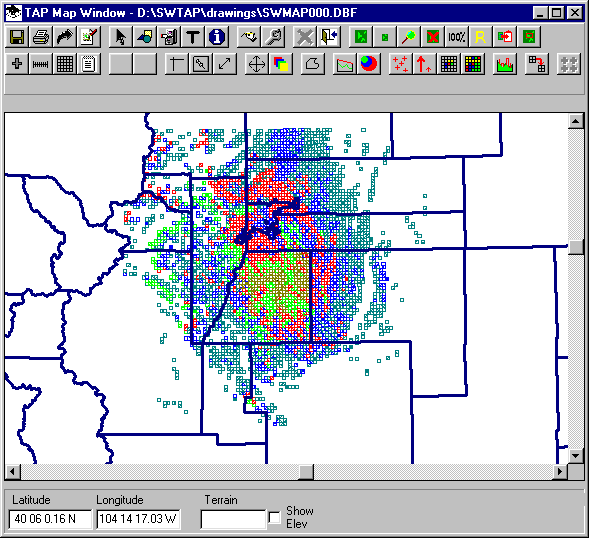
You can un-check the "Plot levels BELOW" box so that locations with a field strength value below the minimum will be left blank on the map. This will further reduce the size of the graphic database.
The coverage map showing the "below" level locations creates a file of 14.6Mb:

The same study, eliminating the "below level" points, creates a 6.8Mb database:
Filtering Points
A little more drastic step if you want to maintain the filled boxes, or if the Points only database is still too big, is to filter the points from the study. You can set a flag in a configuration file to plot every 2nd point, every 5th point, etc. That means you sacrifice a little detail but can see the overall picture. To do this, find the file SWDEFAULTS.INI in the folder where TAP is installed (typically the SWTAP folder). Open the file with Notepad and find a section header line:
[Map Window]
Immediately after this line add the following line:
RDBjump = 3
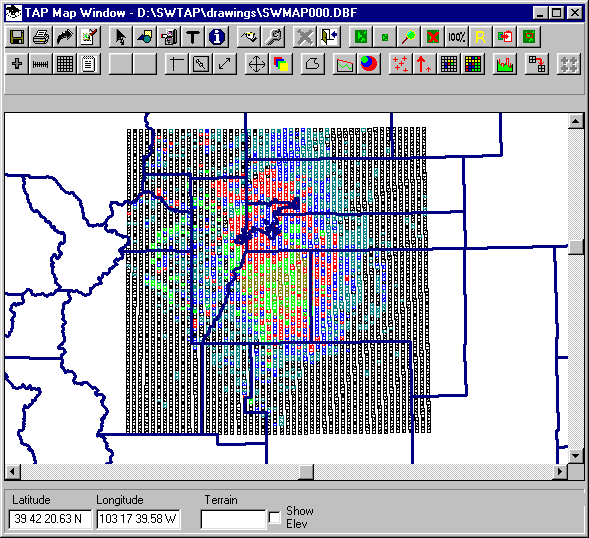
This will plot every third point. You can change the number to whatever value is helpful for you.
The complete plot creates a 14.6Mb file:
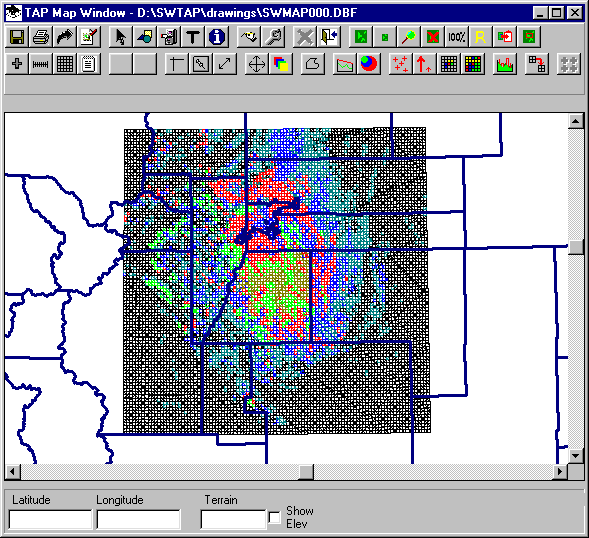
Filtering every other point creates a database of about 8Mb:
Planning Before the Study
If you can plan ahead when you are setting up the study to run, consider how much detail you need.
For example, if you are computing a coverage over an area 100 miles square, but your presentation will be on a page that is 8-1/2 x 11 inches, the spacing on the page between points a mile apart will be about 0.08 inches.
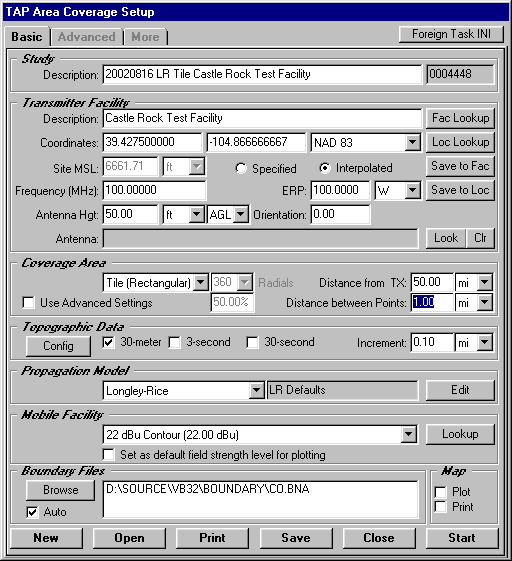
Setting the "Distance between points" on the Area Coverage Setup to be 0.1 mile would make the spacing between the points less than 1/100th of an inch, which may be difficult or impossible to distinguish on many printers. The point is, while "the more detail the better" sounds good in theory, it may have some practical limitations, both for the processing time to run the study, and the realistic presentation of the results. Naturally, you can also run a large area study at a lower point resolution, then run one or more separate, smaller studies with lots of detail in those areas of particular interest. As it relates to the question about the error message, smaller studies (i.e., fewer points computed) will have less of a problem with the 100Mb database limitation.
Copyright 2002 by SoftWright LLC