Q: How do I set the levels for plotting different field strength
values in TAP?
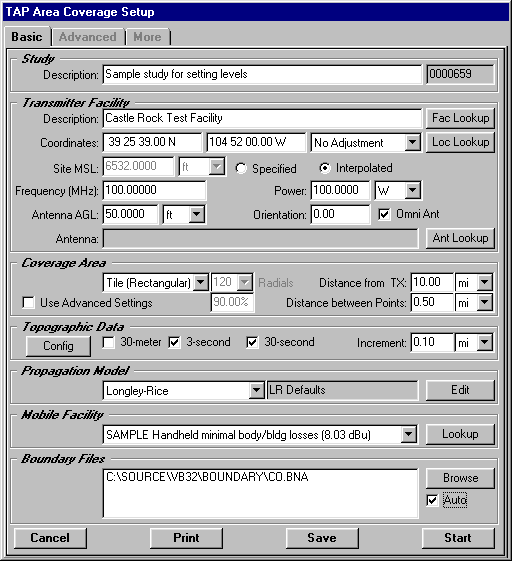
A: You must first set up and execute the Area Coverage
study (as described in the TAP Tutorial). For example, suppose
you set up the following study:
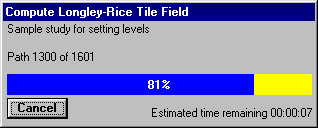
When you click the Start button, the study will be executed
and a progress bar will be displayed.
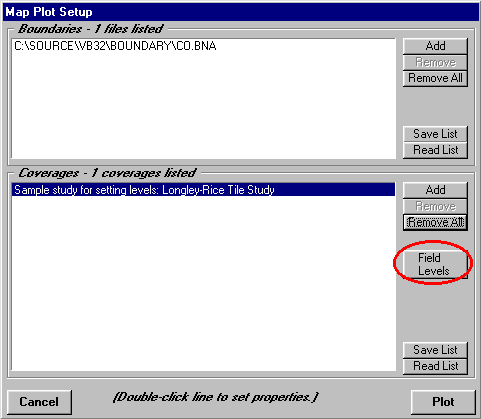
When the study is completed you will be prompted to confirm
the boundary and coverages you want to plot. Click the "Field
Levels" button to display the form used to set the level
information.
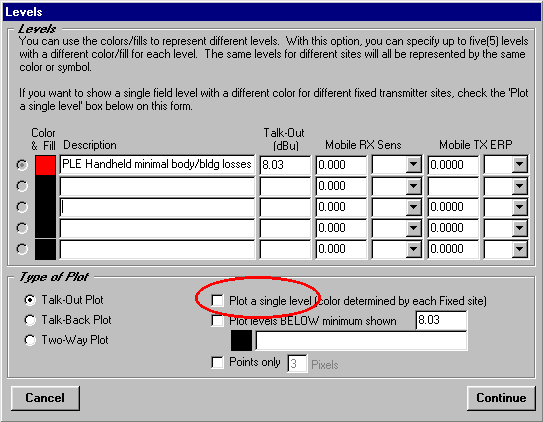
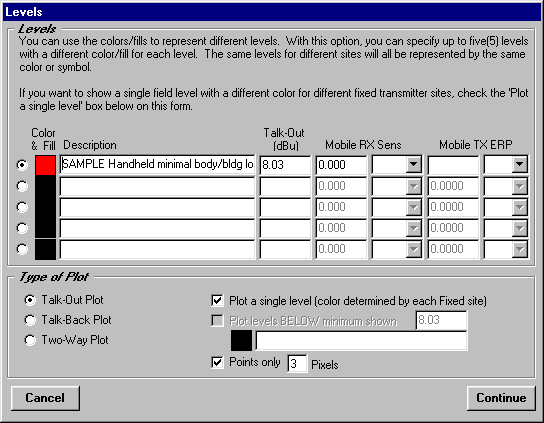
The Levels form will be displayed. By default, the form is
configured to plot a single level, determined by the mobile facility
specified in the Area Coverage setup, in this case the "SAMPLE
Handheld minimal body/building losses" with a required field
strength of about 8dBu. (Note that these values are for this
illustration only. You should determine the field levels appropriate
to your system requirements.)
To plot more than a single level, you must first clear the
"Plot a single level" box:
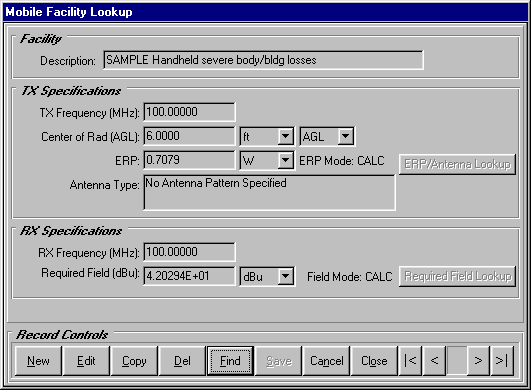
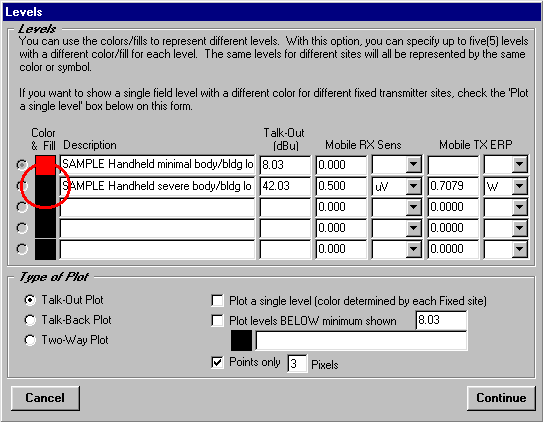
When you close the Mobile Facility lookup, the values for
the selected mobile facility record will be inserted into the
levels. To change the color for the new level, double click on
the black square to the left of the line:
You will be prompted for a color and fill type (such as a
crosshatch) and the new color will be shown:
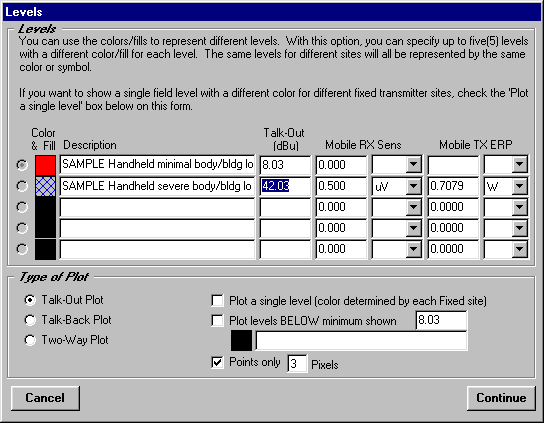
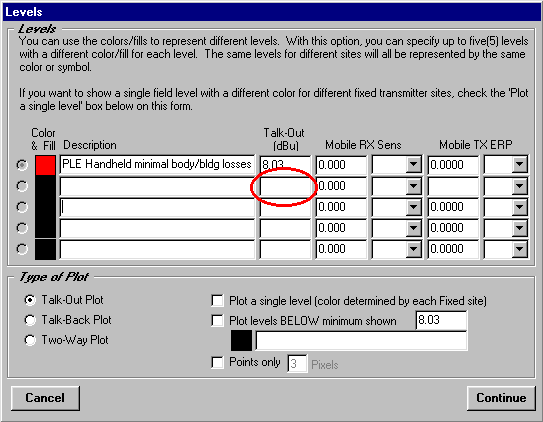
You can also manually enter a signal level to plot. Type in
a description and signal level, and double-click the box to set
the color:
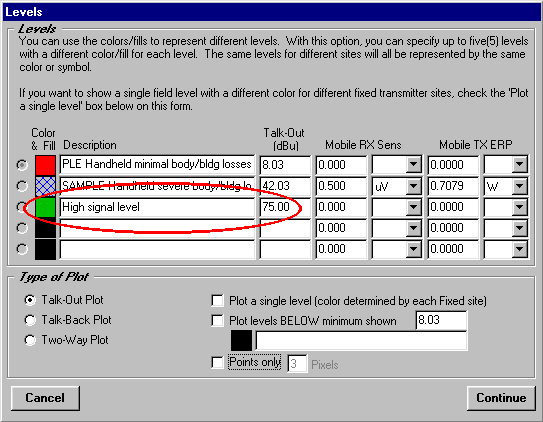
You can plot the locations and include the fill pattern by
clearing the "Points Only" check box.
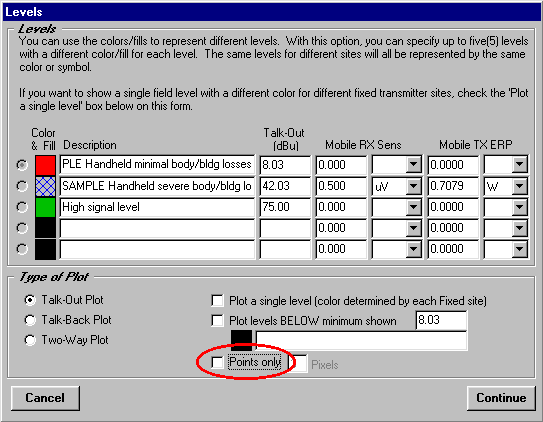
If the Points Only box is checked, the locations will be plotted
with colored points (ignoring the fill pattern). This type of
plot is faster than the filled type.
Click the "Continue" button on the Levels form,
then click the "Plot" button on the Map Plot Setup
form to draw the map.
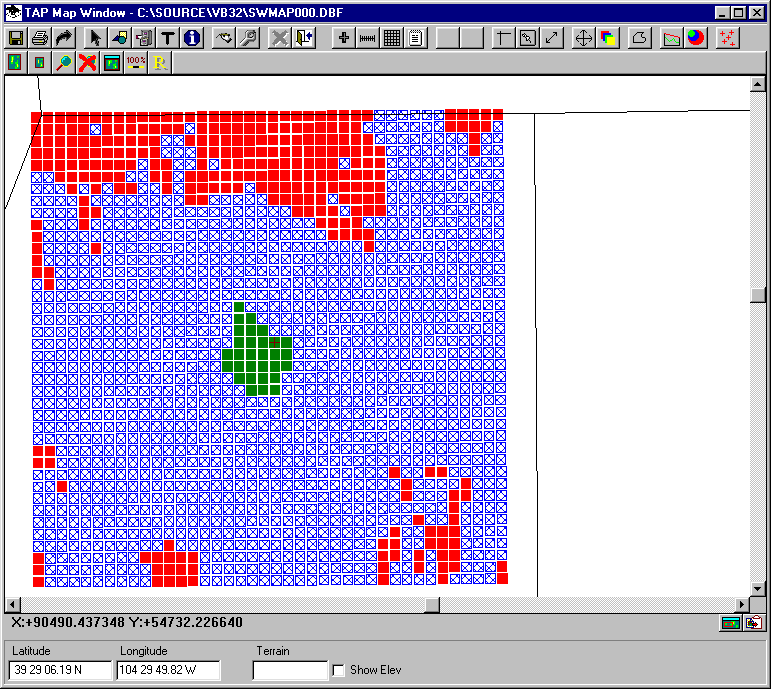
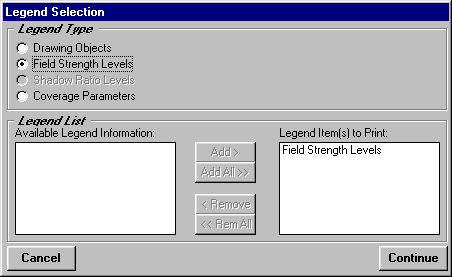
You can add a legend of the levels to the map with the Legends
button on the toolbar:

Select "Field Strength Levels" as the Legend Type
and click Continue:
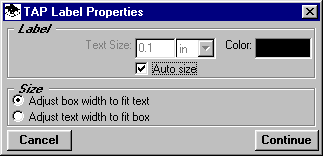
Set the label properties for the legend. You can set the color
of the legend by double-clicking the Color box. The Auto size
box is typically checked. You will be prompted to draw a box
with the mouse, and the text will be sized to fit that box.
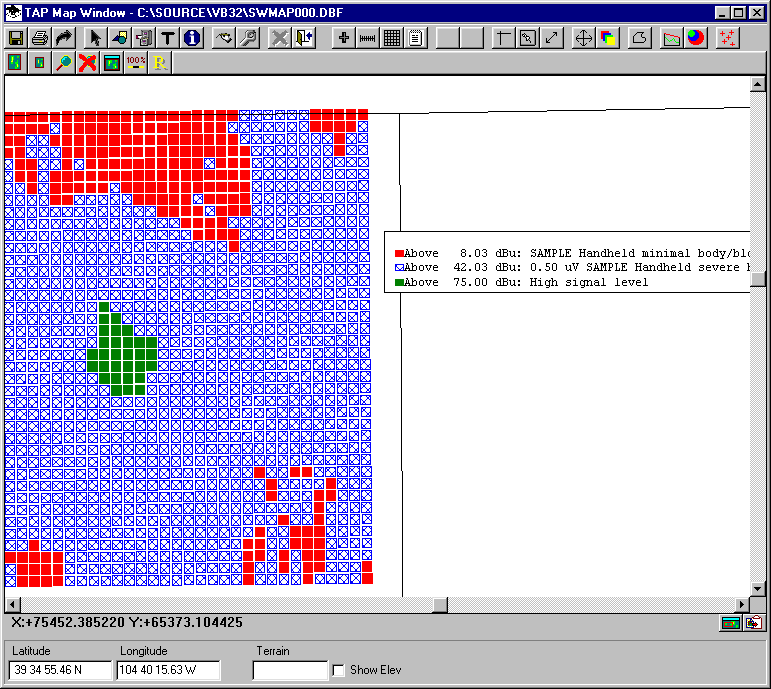
Click the Continue button and you will be prompted to draw
the box where you want the legend, then the legend will be drawn:
Copyright 1999 by SoftWright LLC


