The TAP™ Aggregate Coverage (AC) module, which aggregates the results of multiple individual coverage studies into a single composite coverage result, is one of the most popular TAP™ modules. Since aggregation is a post-processing step, the tool is provided in TAP™ Mapper. The tool allows users to create multi-site composite coverage maps easily even over irregularly bounded areas. Click the following link for a video tutorial on how to Create Multi-Site Aggregate Talkout and Talkback Studies with TAP 7.
The TAP™ Aggregate Coverage module takes the TAP™ signal strength results from multiple area coverage studies, created either using TAP™ or TAP™ Mapper Quick Coverage, and calculates a new resultant area coverage. The Aggregate Coverage tool will calculate the Maximum, Best Server, Simulcast and Desired/Undesired (D/U) aggregation results from any combination of previously calculated individual coverage studies using parameters appropriate for the multi-site system. It will also calculate Composite Talkback coverage to assess talkback coverage from a variety of mobiles to the fixed base stations.
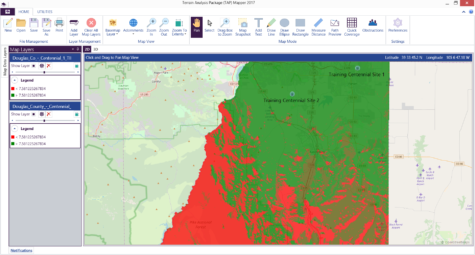
Component coverage studies of interest may be loaded individually as Mapper layers for use in Aggregate Coverage or, alternatively, all TAP™ studies from a project may be loaded by opening the TAP project file. In the image below, two bounded tile studies for two sites in Douglas County, CO, are loaded as Mapper layers.
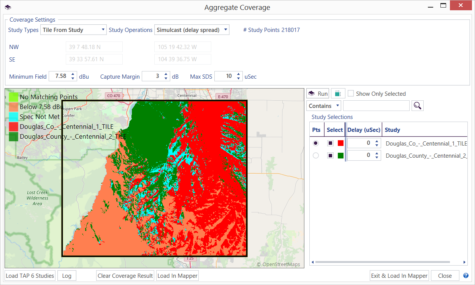
Click on the Aggregate Coverage button of the Utilities tab of the main window to launch the new tool. The default Tile From Study selection to define the Aggregate Coverage area allows the user to select a master study to define the Aggregate Coverage area. Then select Maximum, Best Server, Simulcast, D/U, LTE Calculations (RSRP, RSRQ), or Composite TalkBack as the Study Operation and click the run button. A detailed help file is included with the Mapper installation to describe all pertinent options.
An example Simulcast output is shown below. The results initially appear in the Aggregate Coverage window itself. This allows users to iterate with various settings and component studies. In the image below, the coverage area is color-coded to show the regions served by each transmitter as well as the regions of no service due to low signal or not meeting Capture Margin or Simulcast Delay Spread criteria.
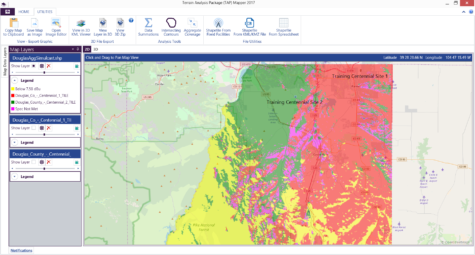
When finished working with Aggregate Coverage, the results can be loaded in Mapper using the “Exit and Load in Mapper” button. As shown below, the resulting Mapper layer may be styled using all Mapper functionality and the component study transmitter sites may be marked and labeled.
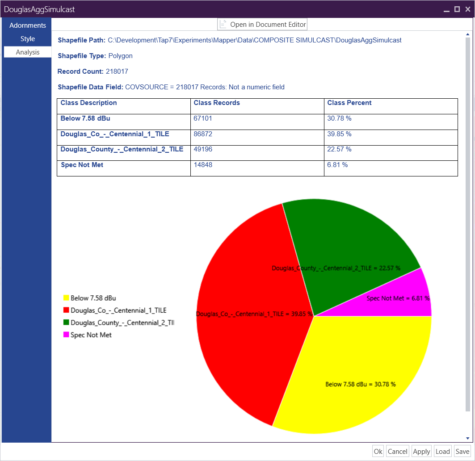
If desired, use the Analysis tab on the Layer Settings window to view the coverage statistics for the Aggregate Coverage study result. This report may be exported as a Microsoft Word or pdf document for sharing.