HDPath™ Introduction
Q: How do I use HDPath?
A: For TAP 5.0.1044 or later systems with a Maintenance Subscription date of August 31, 2005, or later, path profiles can be drawn with the HDPath software.
HDPath is a new user-interface for path-based functions in TAP, such as path profiles. This new interface provides increase flexibility for setting up the end point sites for a path, and for changing parameters (such as effective earth curvature or surface features) that affect the analysis of that path.
HDPath presents almost all of the pertinent path information on a single form.
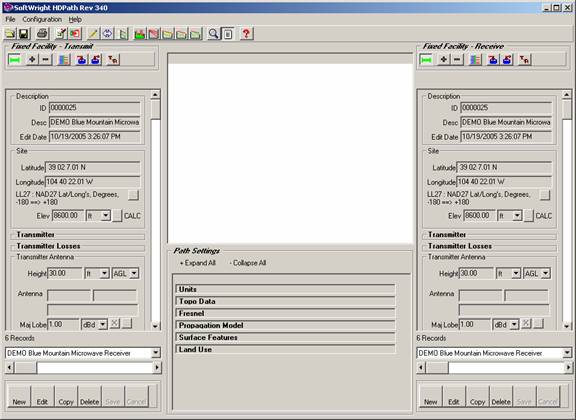
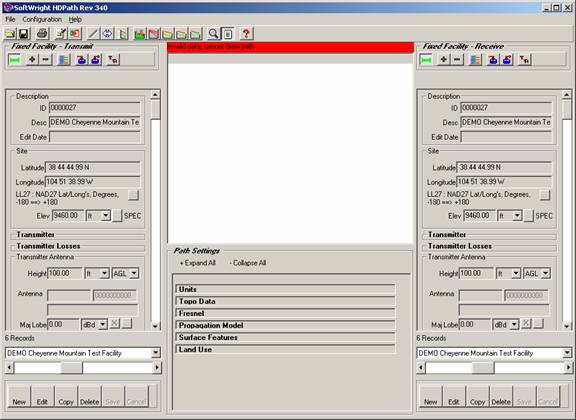
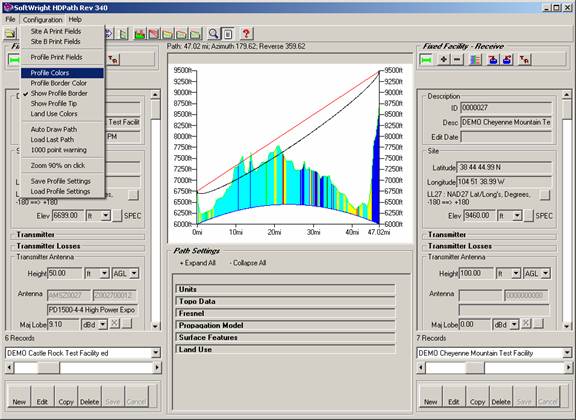
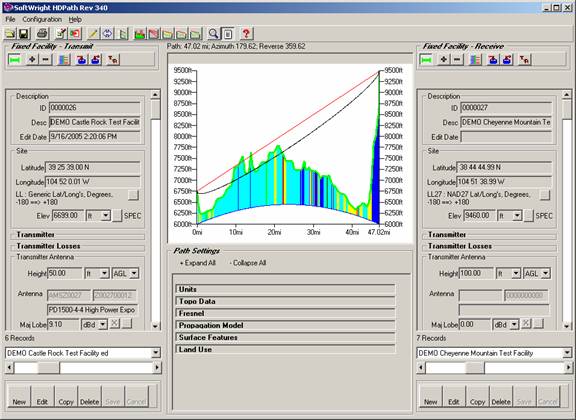
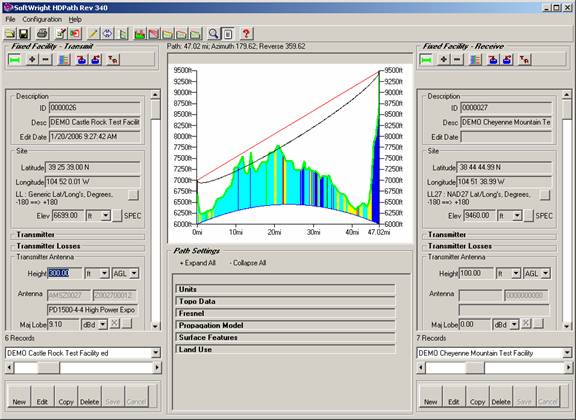
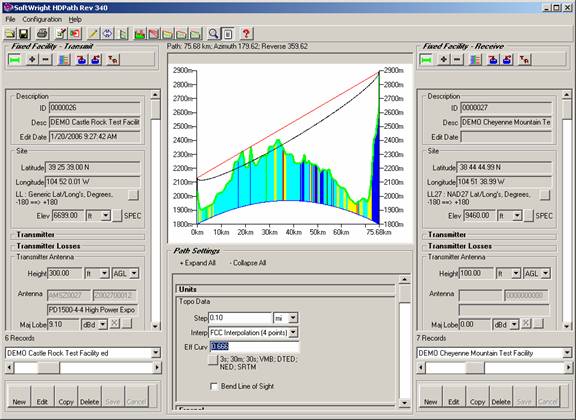
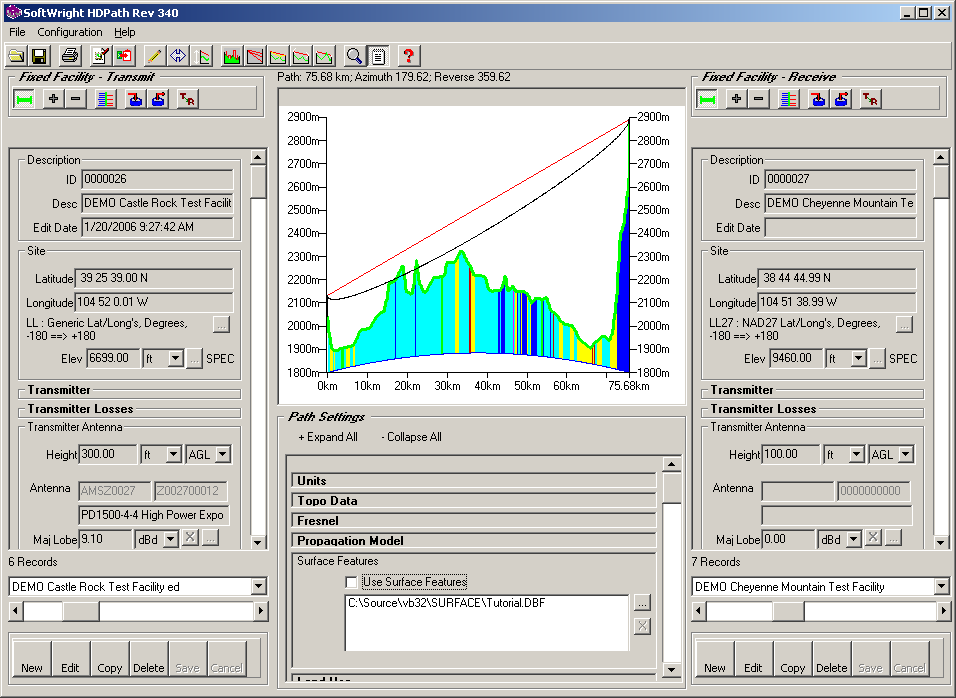
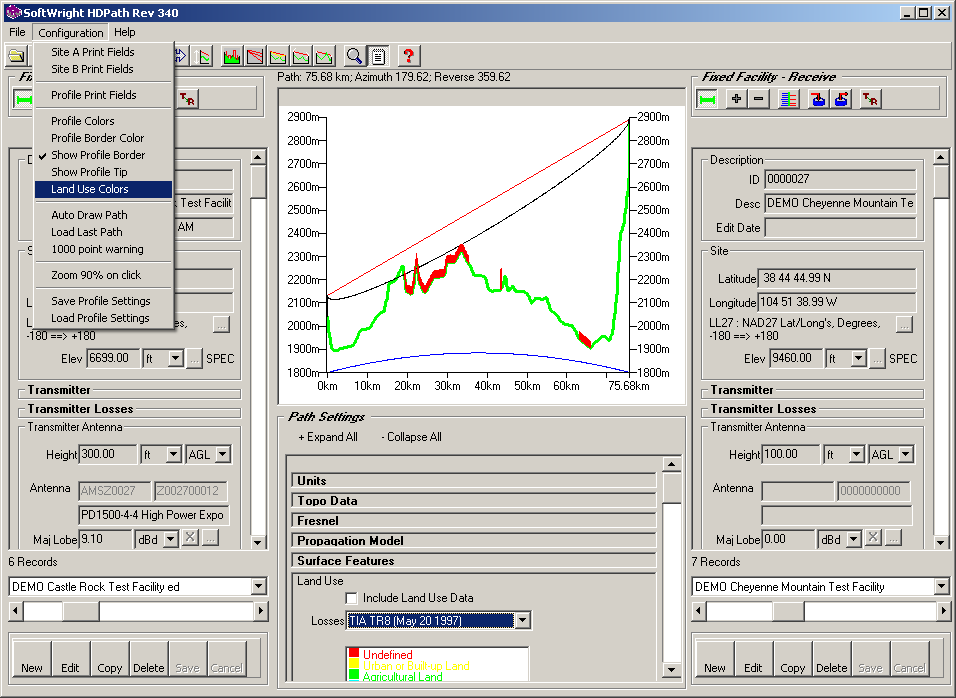
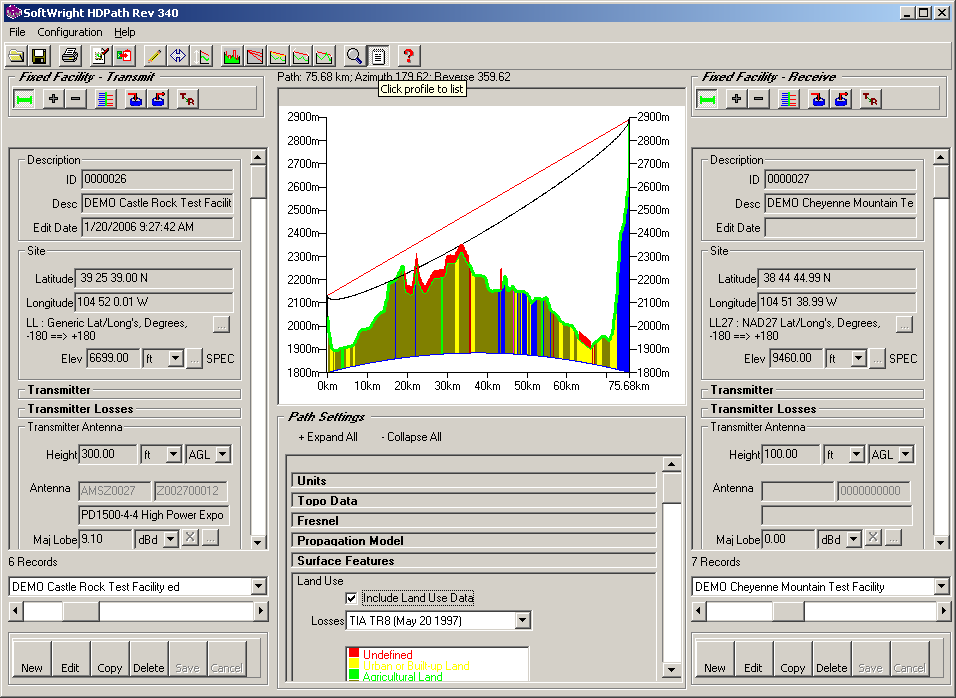
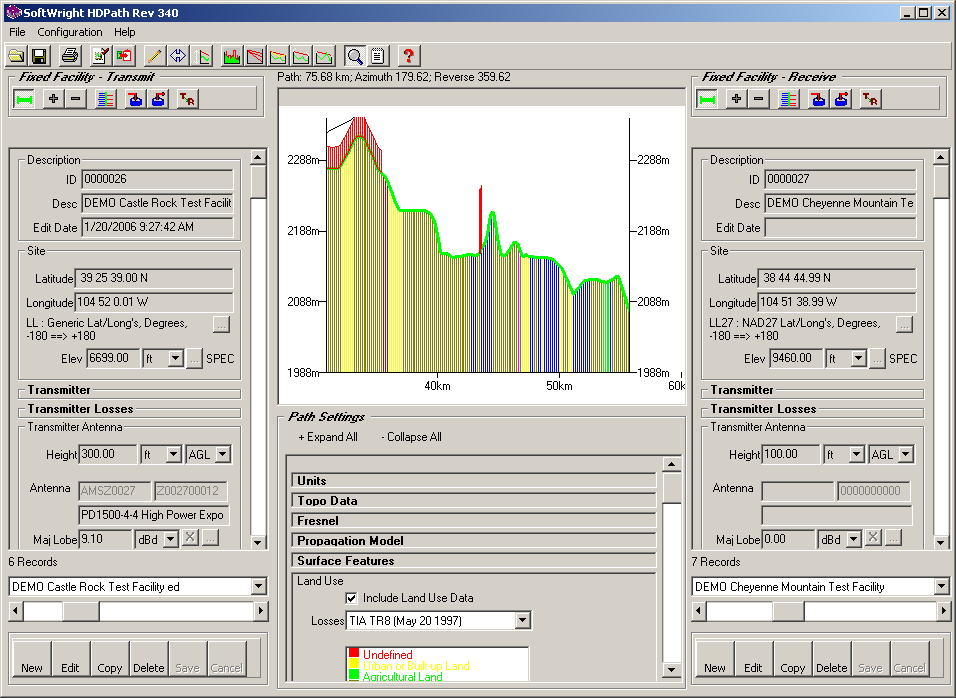
When HDPath is launched, the path form is displayed:
This form displays two instances of the Fixed Facility Database Interface, shown on the left and right sides of the form. These sections are used to set up the end points for the path.
By convention, the left side of the form is considered the Transmit site, so the relevant parameters (transmit antenna height, etc) are used for that record. The right side of the form is considered the Receive site, so the receiver antenna height is used for that site.
The easiest way to draw a profile is to find the desired records in the Fixed Facility Database. (Sites that are not included in the Fixed Facility Database can be used by disconnecting HDPath from the database as described in the FAQ about the Fixed Facility Interface.)
Find the site you want for each end of the path:
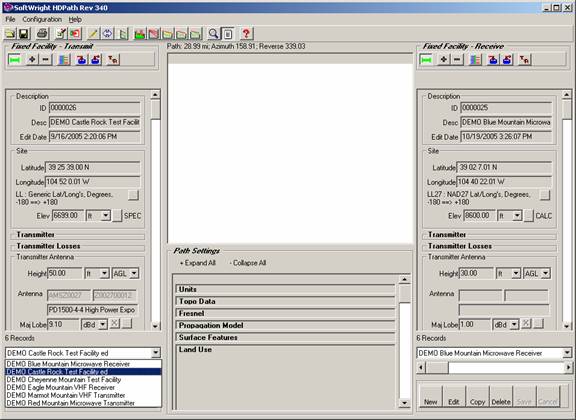
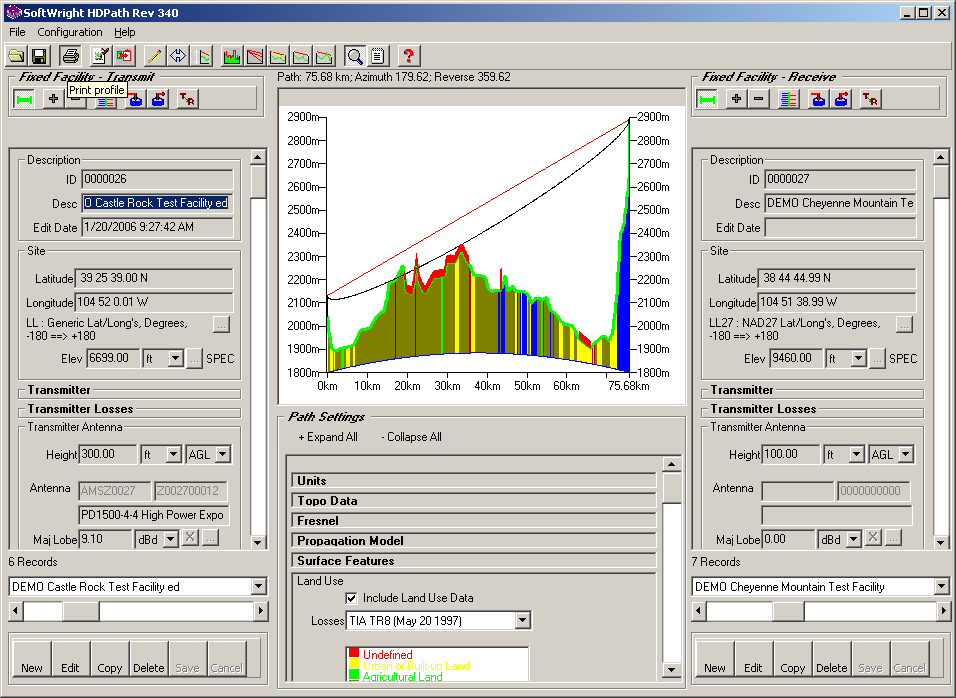
When desired sites are displayed, click the Draw button:
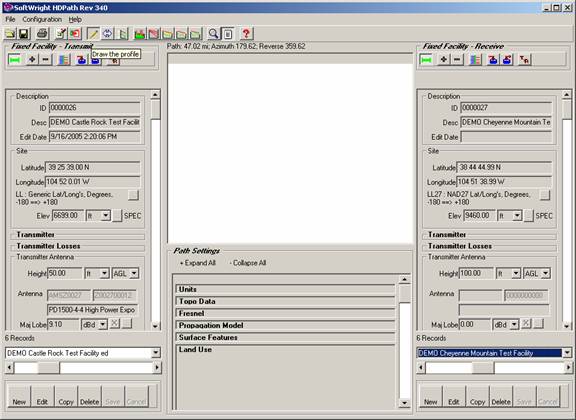
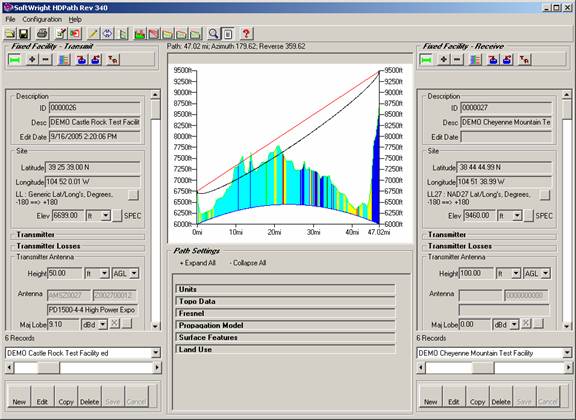
When the Draw button is clicked, the path profile will be displayed:
Note several safeguards in the program:
If you have a "zero-length" path defined (that is, both selected sites are at the same location) a red warning label is displayed, and no path profile can be drawn.
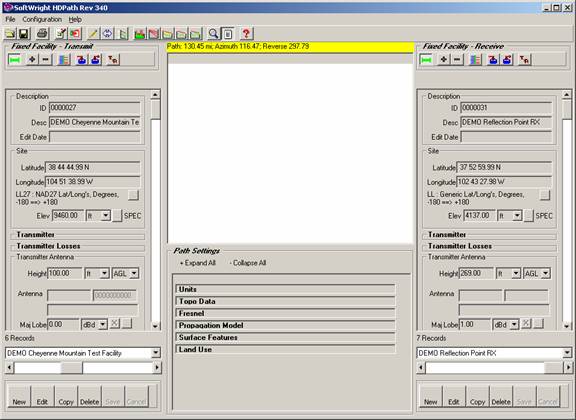
If the selected sites define an unusually long path, a yellow warning label is displayed:
If you click the Draw button, a warning dialog box is displayed to confirm the long path:
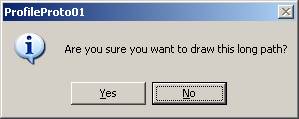
You can cancel the plot by clicking the No button.
You can change the criterion for this warning message (the number of points on the path) by clicking the Configuration menu and selecting the "Point Warning" item.
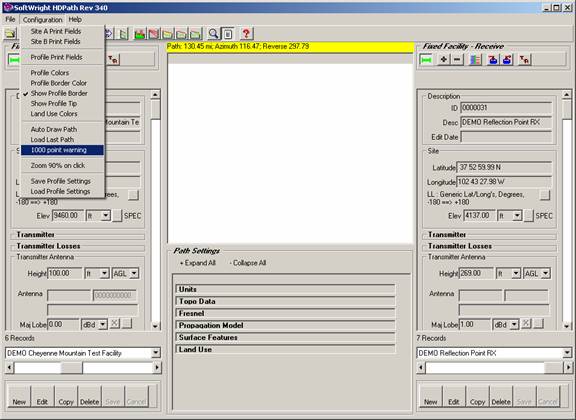
You will be prompted to enter the number of points you want to set as the threshold for the warning message.
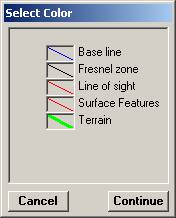
You can change the colors used on the profile from the Configuration menu by choosing Profile Colors::
The Select Color form is displayed:
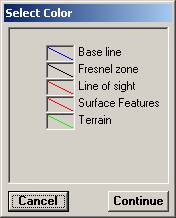
Click the item you want to change, such as the Terrain:
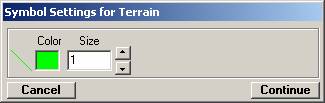
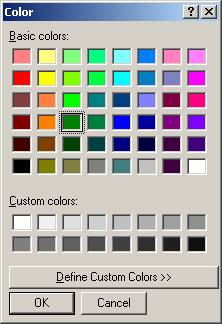
You can change the color by clicking the Color box and selecting the desired color:
You can change the line width by entering a value or clicking the up and down arrows:
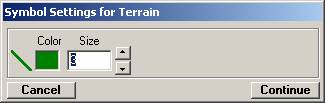
Click continue to return to the Select Color form:
Click Continue to return to the HDPath form:
Changes to the basic profile can be made by editing the Facility information for either end of the path.
For example, you can change the transmitter antenna height by editing the left side record:
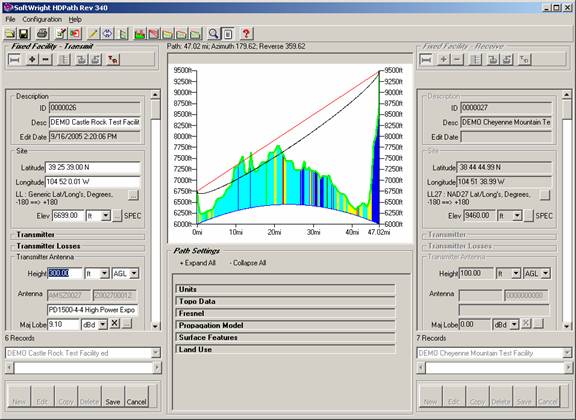
Change the value and Save the record. When you click the Draw button, the change will be shown on the profile:
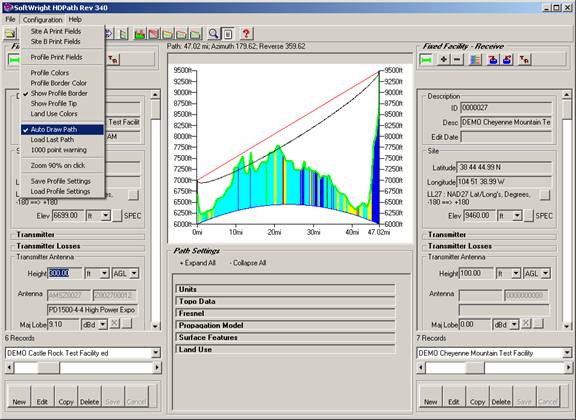
(If you check the "Auto Draw Path" option in the Configuration menu, the profile is redrawn automatically when changes are made.)
Several path parameters can be changed using the collapsible headings below the profile.
To change the units used on the path, click the Units label to open the Units section:
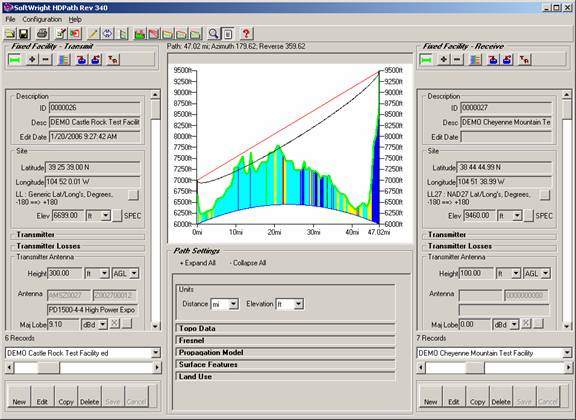
You can change the distance and/or the elevation units for the profile. The changes will be applied when you click the Draw button (or immediately if the Auto box is checked):

To change the topographic elevation data used on the path, click the Topo Data label to open the Topo Data section:
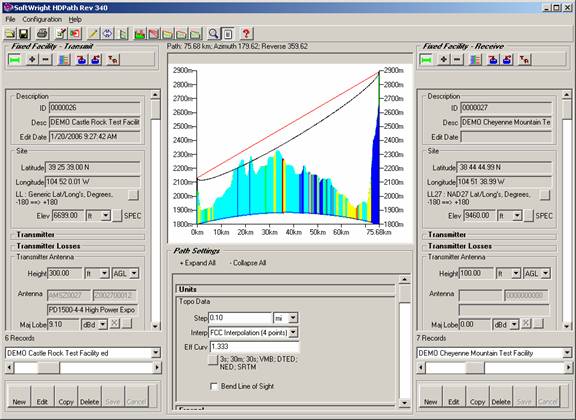
You can change the type of data used, or the increment ("step") between the elevation points, the elevation interpolation method used, or the effective earth curvature used.
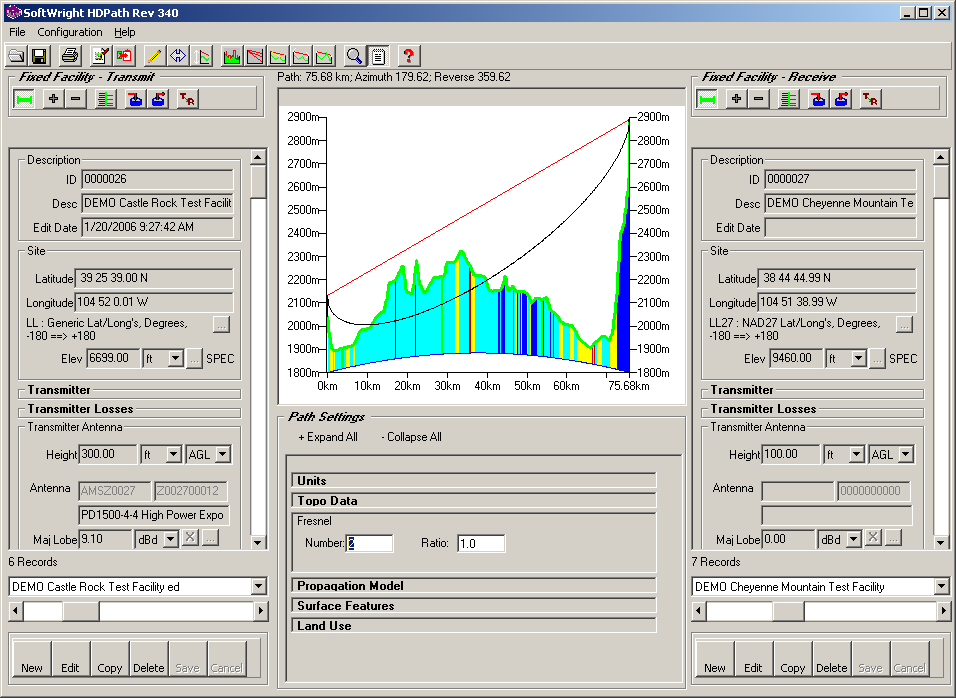
For example, you can change the effective earth curvature to "2/3 earth" (0.666) instead of "4/3 earth" (1.333):
(Note the difference in the curvature base line, and the increased line-of-sight obstruction by comparing this plot to the 1.333 plot above.)
If the Auto box is checked, changes in manually entered values (like typing in the earth curvature value) are applied when you click the mouse outside of the box where you are typing. Moving the mouse out of that text area indicates to the program that you have completed your entry.
To change the Fresnel zone value used on the path, click the Fresnel label to open the Fresnel section:
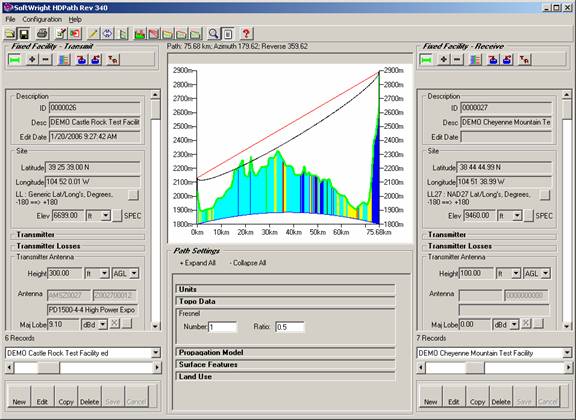
The Fresnel zone is drawn using the frequency from the left side (transmit) facility information.
You can change the Fresnel zone number and ratio in the Fresnel section. For example, using even-number Fresnel zones and a ratio of 1.0 can be useful in checking for reflection points on a path:
(This path is not a particularly good illustration of reflection analysis. For more information on this topic, see the TAP article on Reflection Analysis.)
To change the Surface Feature files used on the path, click the Surface Features label to open the Surface Features section:
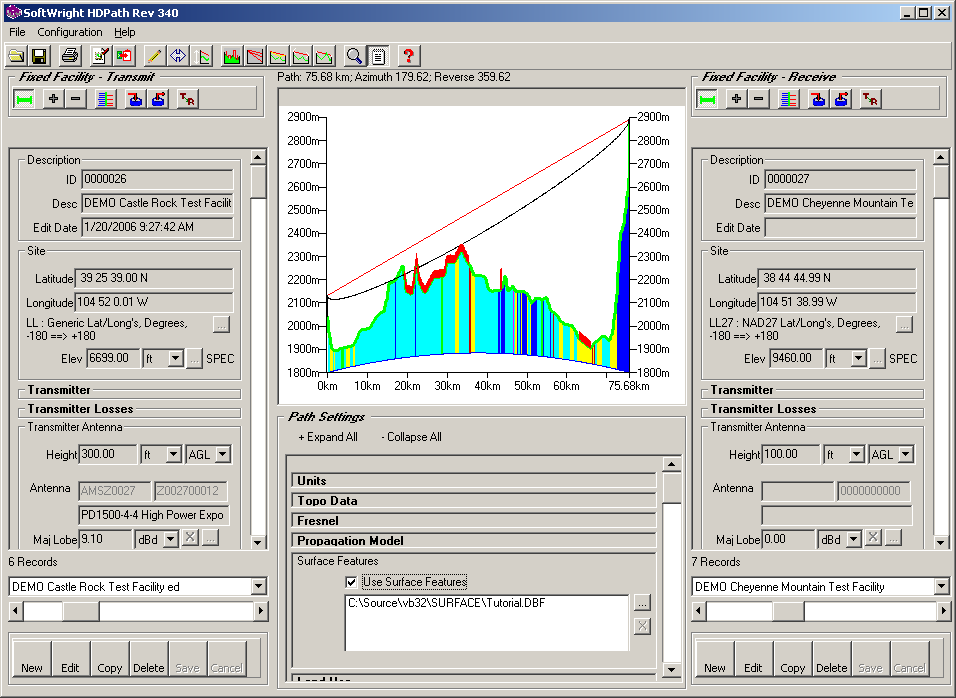
(You can also use the Surface Feature Editor to add new surface feature objects graphically from the profile.)
You can choose to ignore Surface Feature files by un-checking the "Use Surface Features" box:
You could also use the "X" button to remove selected Surface Feature files from the list. The "…" browse button is used to add Surface Feature files to the list. Naturally, only surface features that are intersected by the selected path will be shown on the profile.
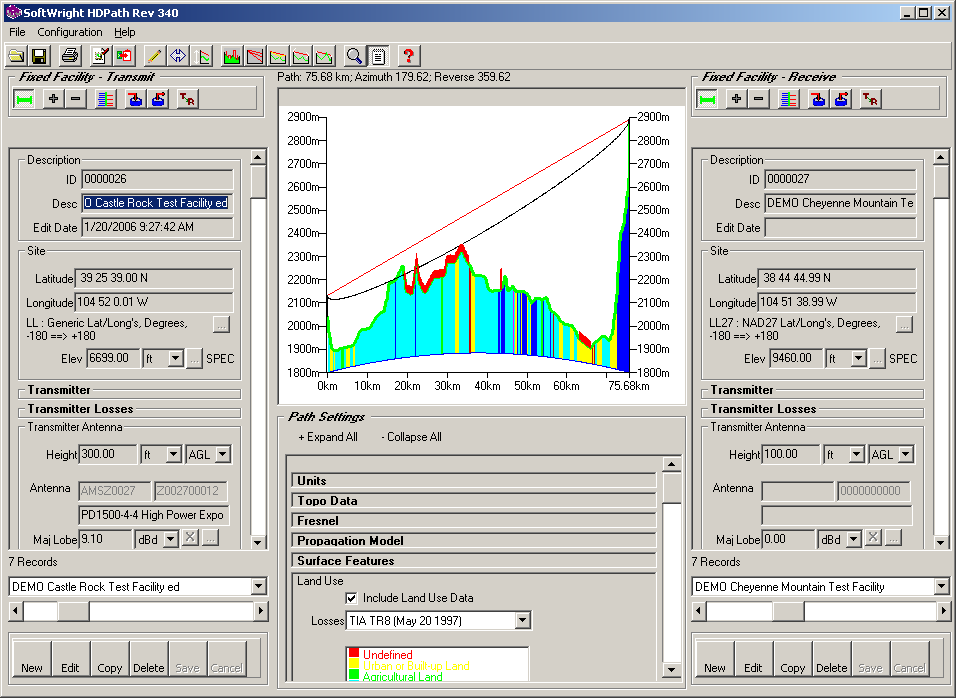
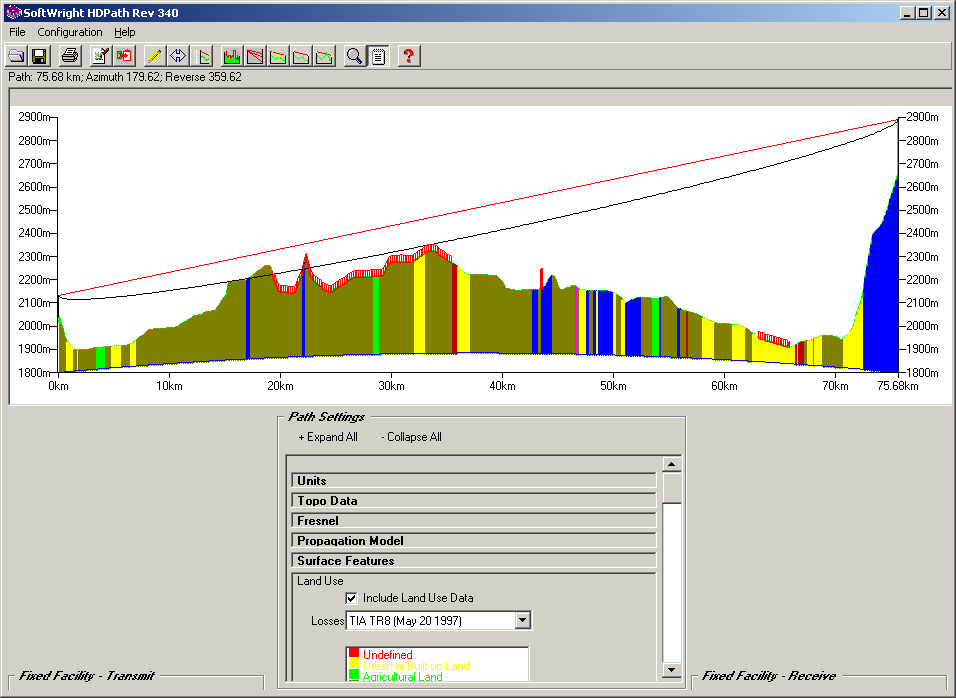
To change the Land Use features used on the path, click the Land Use label to open the Land Use section:
(Note that if the section you want displays below the bottom of the form, you can use the vertical scroll bar on the right of the list of sections to scroll up and down on the list.)
Land Use information can also be used as a guideline for adding Surface Feature objects to the profile.
You can remove the Land Use information (shown as the colors below the profile) by un-checking the "Include Land Use Data" box:
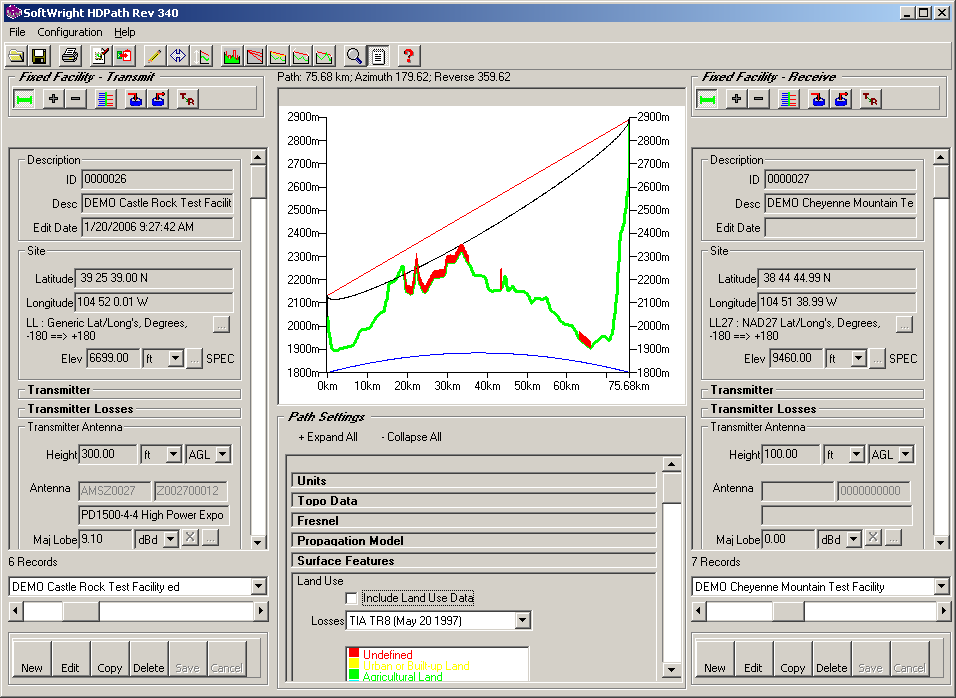
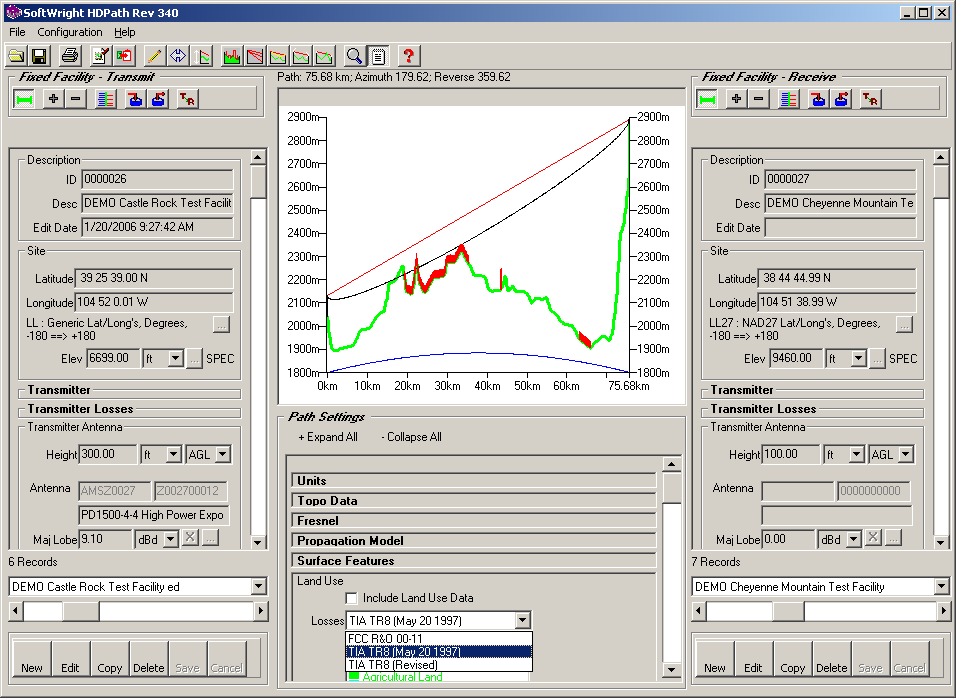
The pull-down list indicates the loss template to be used in computing signal loss values at locations based on the transmit frequency and Land Use code at each location:
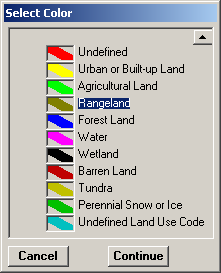
You can change the colors used for the Land Use classifications from the Configuration menu:
The Select Color form is displayed:
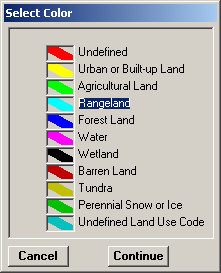
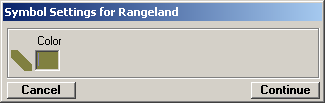
Click the item you want to change, such as the Rangeland land use classification:
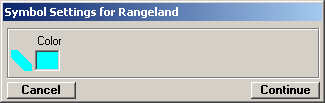
Click the color box to change the color for the selected classification:
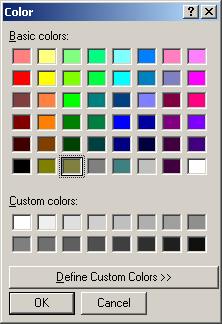
Exit from the forms to return to the HDPath form:
Click Continue to return to the Select Color form:
Click Continue to return to the HDPath form. Be sure the Include Land Use Data box is checked. The new color selection is displayed:

Be sure the List button is selected on the toolbar:
When this button is selected, you can right-click on the profile to enlarge the profile to fill the entire form:
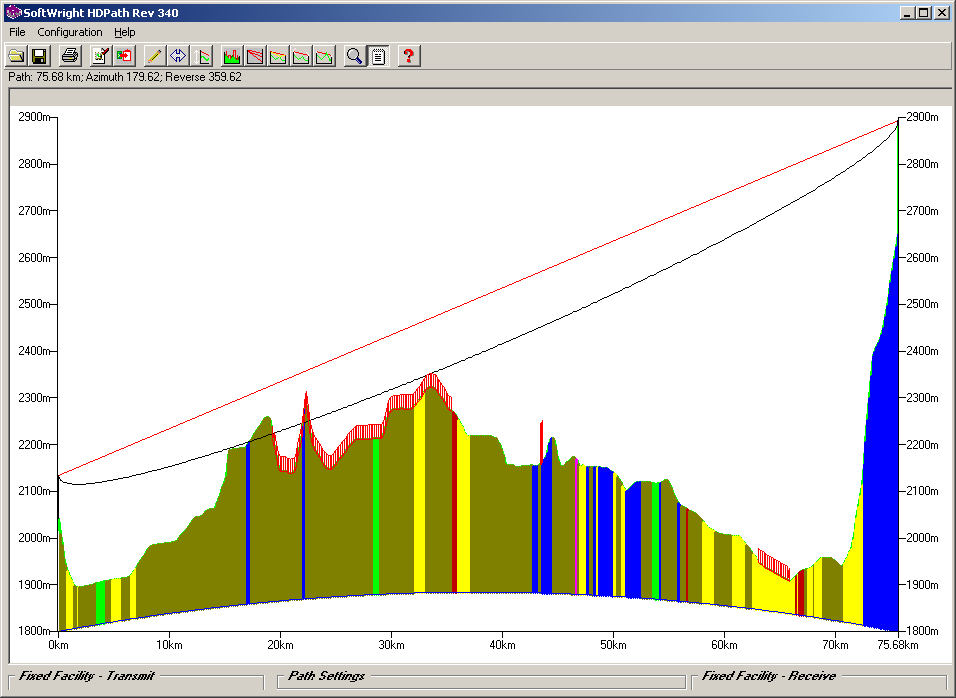
Right-click the profile again to restore the normal view.
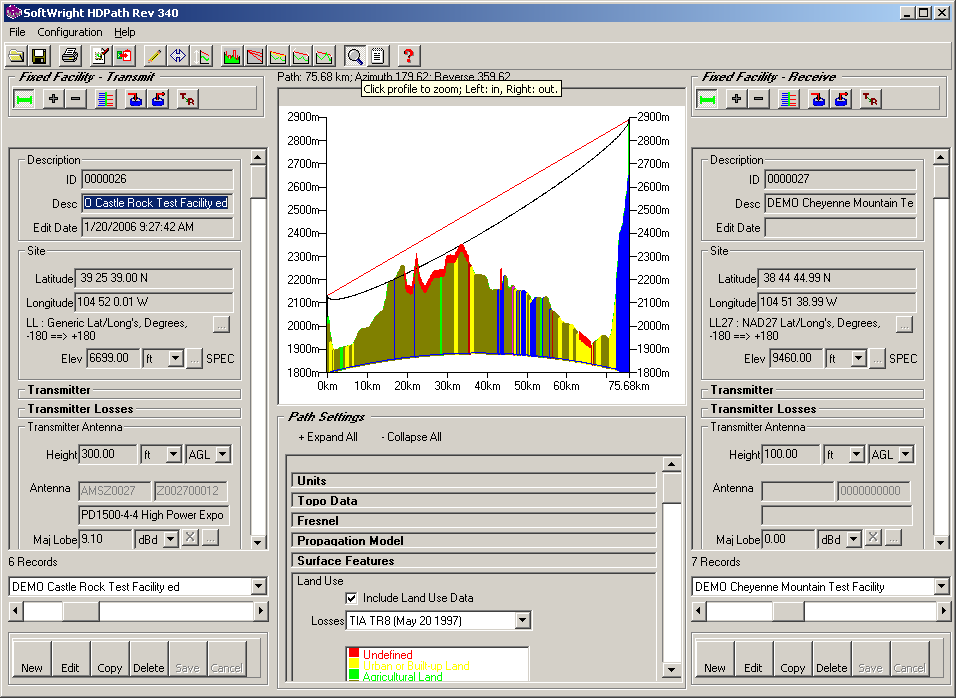
You can also collapse any of the sections around the profile (Fixed Facility - Transmit, Fixed Facility - Receive, or Path Settings) if these sections are not needed and you want to expand the profile graphic. For example, if you click the Fixed Facility labels for the Transmit and Receive sections, those sections are collapsed and the profile graphic is expanded, but you still have access to the Path Settings section:
You can restore the collapsed sections by clicking their labels at the bottom of the form.
When the mouse cursor is moved over the profile window, information about the cursor location is displayed on the Mouse Location on Path form :
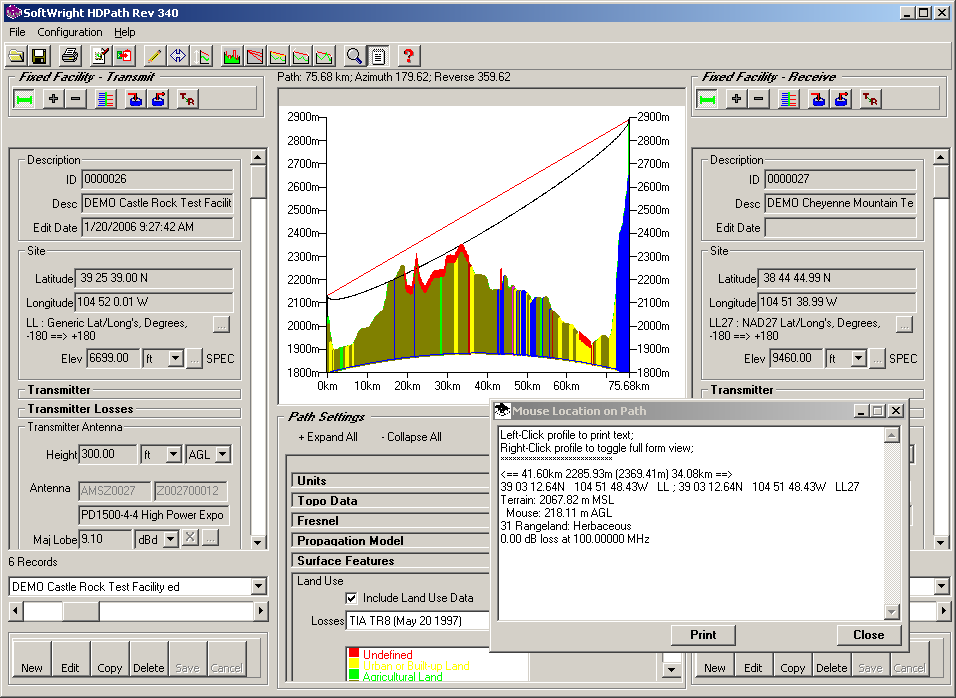
You can close the form if you do not need the information. The form is redisplayed every time you click the Draw button.
The information is displayed as shown:
The first line displays the distance from each site, along with the cursor elevation and, in parentheses, the elevation adjusted for earth curvature. Note that the elevation is the elevation of the mouse location, not the elevation of the terrain (unless the mouse is positioned on the terrain).
<== 22.61km 2292.50m (2363.16m) 53.07km ==>
The next line displays the coordinates of the mouse cursor along the path. If the two end-points have coordinates in different coordinate systems, the coordinates are displayed in both reference systems:
39 13 26.19N 104 51 53.69W LL ; 39 13 26.19N 104 51 53.69W LL27
If the Land Use option is enabled, the USGS land use classification code number and the corresponding description are displayed:
32 Rangeland: Shrub and Brush
If the Land Use option is enabled and the Transmit (left side) facility has a legitimate frequency value, the loss value for the selected template, frequency, and land use classification is displayed:
0.00 dB loss at 150.00000 MHz
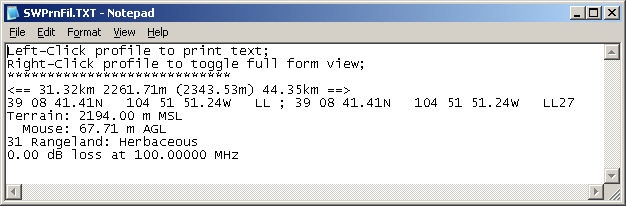
If you click the left-mouse button on the profile (when the List button is selected), the text information is copied to the Windows clipboard. You can then use the Edit|Paste menu function to paste the clipboard contents into another application, such as WordPad:
You can click the Zoom button instead of the List button:
Now mouse clicks on the profile graphic will zoom in (left button) or out (right button) on the graphic. The graphic will zoom with the center located at the point clicked:
By default, each click changes the scale of the profile graphic to 90% of the original scale. You can change the amount of zoom by clicking the Zoom setting in the Configuration menu:
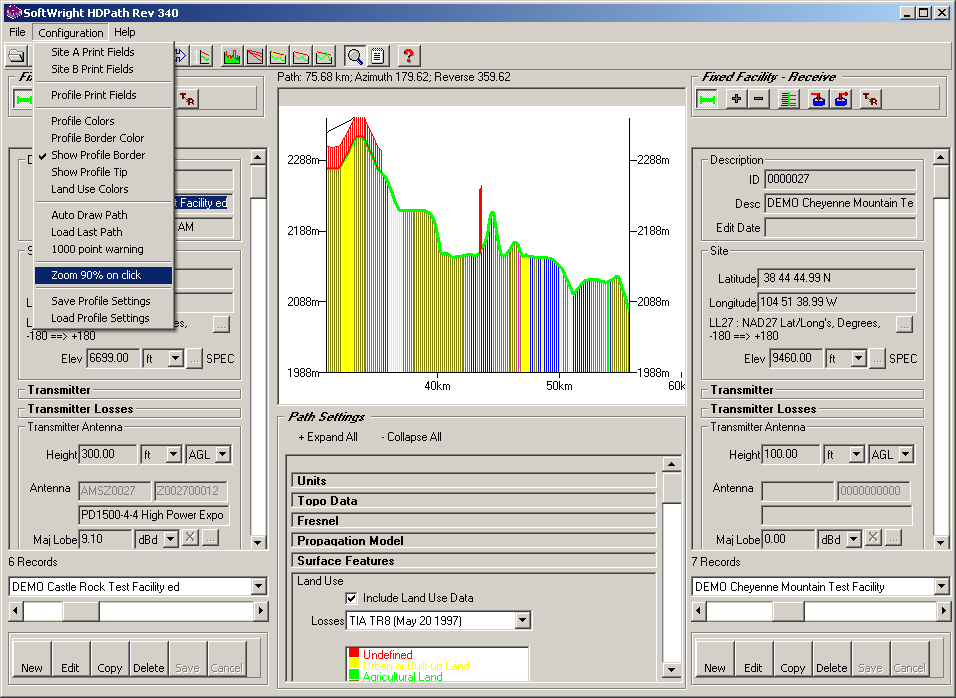
You will be prompted for the zoom value you want to use.
HDPath includes the TAP Print Preview function that enables you to position and edit labels on the profile print out.
To display the print preview, click the Print button:
The Print Setup form is displayed so you can select the printer, paper size, and page orientation:
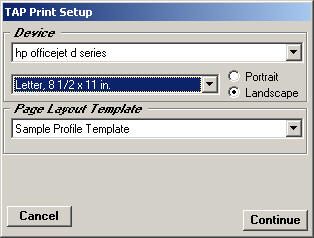
(The Page Layout Template section is only displayed if one or more templates have been defined.)
Click the Continue button to display the Print Preview form:
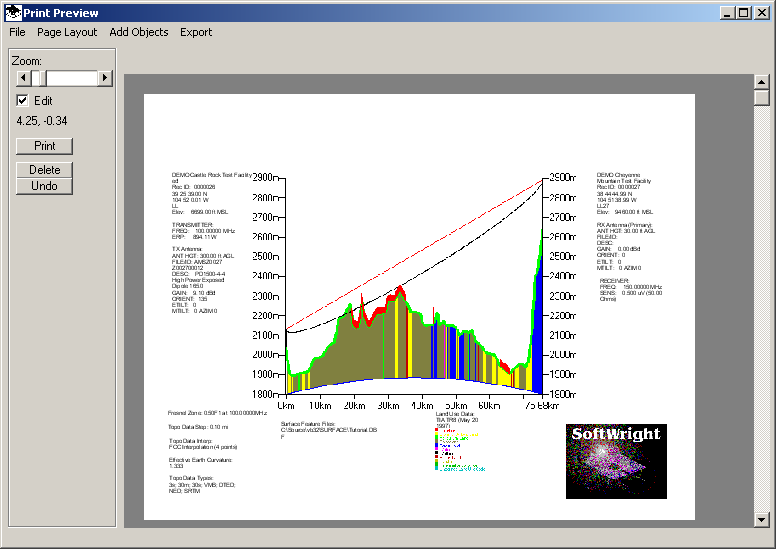
You can use the Zoom scroll bar to zoom closer on the drawing:
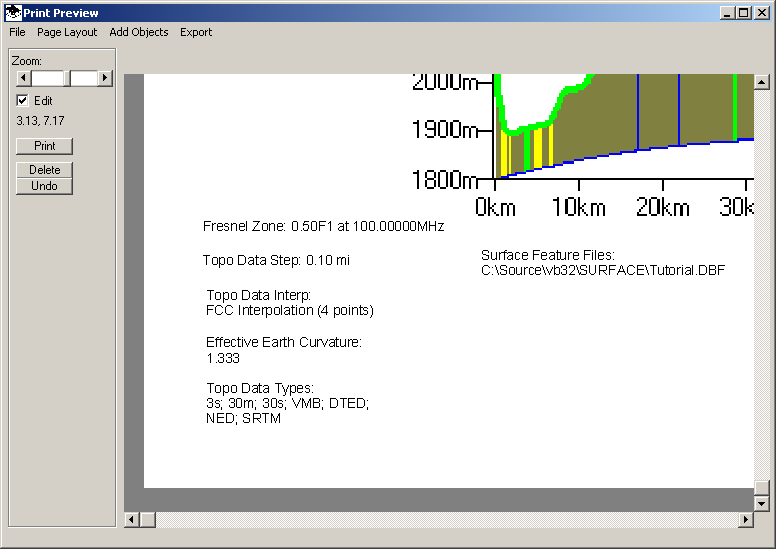
If the Edit box is checked (on the left side of the Print Preview form) you can click a label on the preview to select the label:
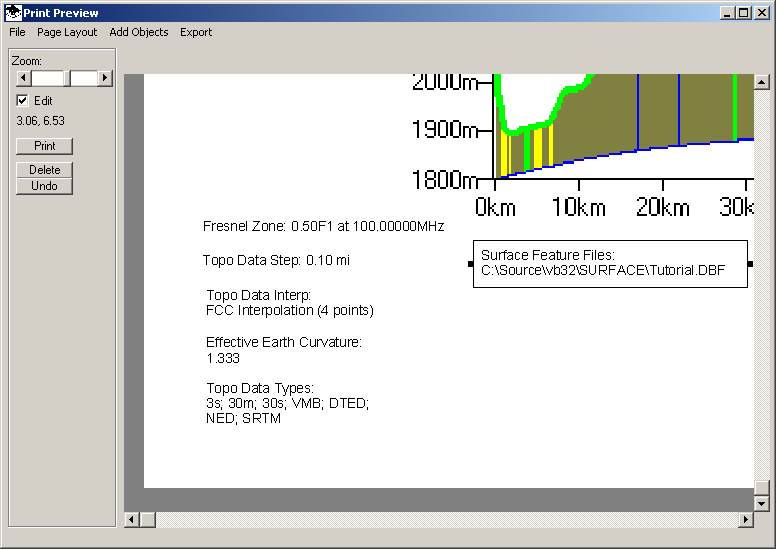
Drag the label to reposition it:
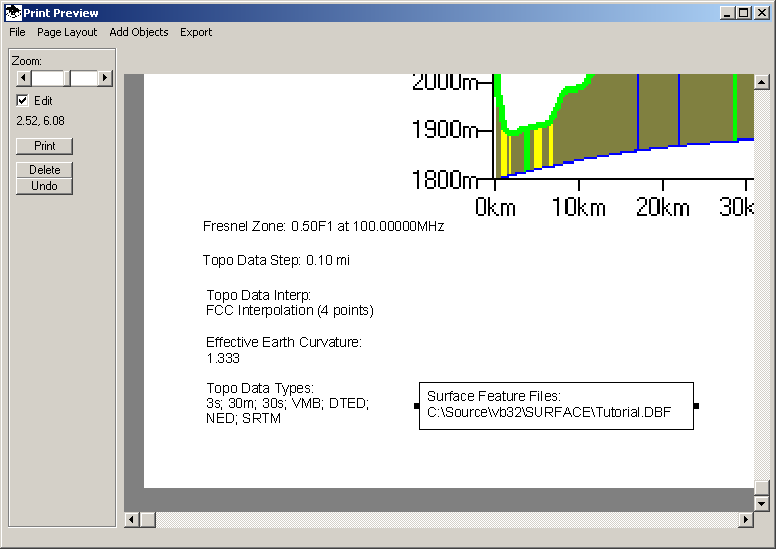
The numbers below the Print button on the Print Preview form display the X and Y location of the cursor on the page.
If the Edit checkbox is un-checked, you can drag the left-mouse on the drawing to pan to a different location of the preview:
You can also select a label (if the Edit box is checked) by double-clicking, and the "Edit Object" form is displayed:
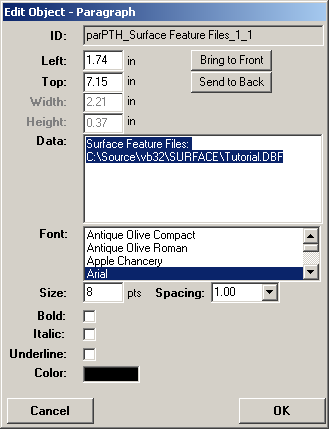
You can change the text, font, color etc., of the label:
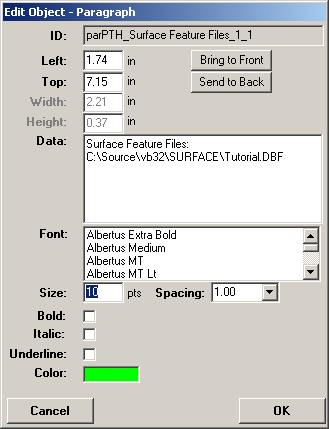
Click the OK button to apply the changes:
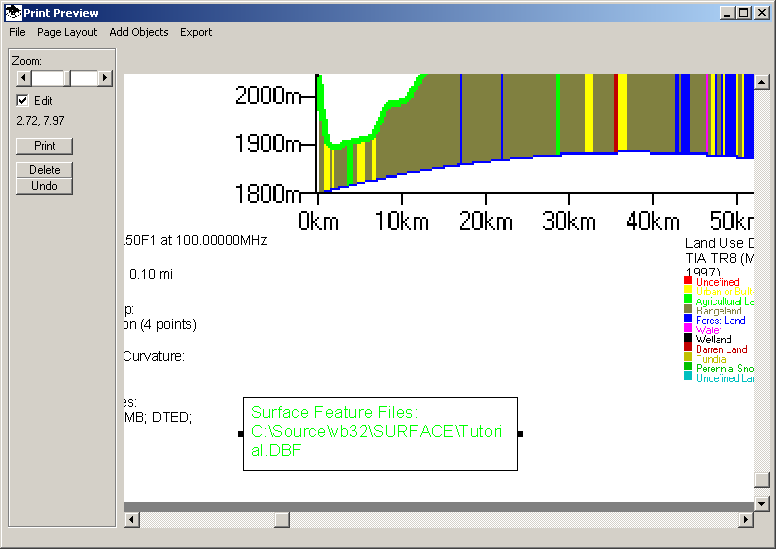
Note that if changes are made to the label, it may be necessary to resize the label using the handles on the label:

Copyright 2012 by SoftWright LLC