Talk-Back System Margin
Q: I have computed a coverage contour for my Talk-Out coverage, but how do I show a contour representing my Talk-Back area?
A: For TAP 4.5.926 systems with a Maintenance Subscription date of October 10, 2003 or later, you can use a utility to compute the Talk-Back margin. This margin is the value of the difference between the Talk-Out and Talk-Back signal levels.
The Talk-Back locations are typically shown with a plot of radial or tile studies. In these plots, the Talk-Back margin is computed internally, and the value is used to display the locations in the radial or tile study with Talk-Back coverage.
For contour coverage plots, you can use the Talk-Back Margin utility to determine the contour level that will show the area for Talk-Back in the system.
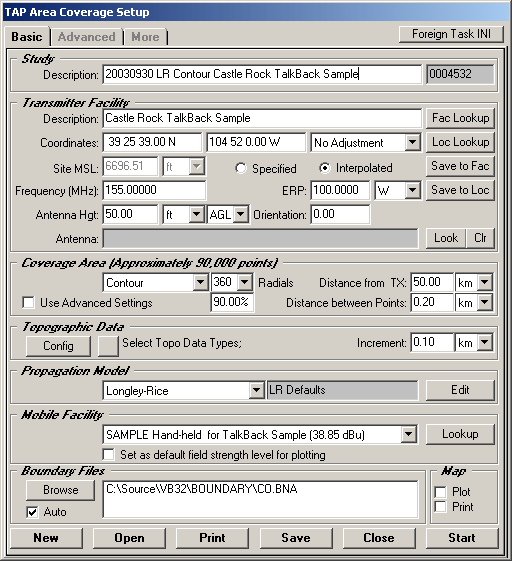
For example, suppose you compute the Talk-Out coverage for a particular Fixed Facility base station and Mobile Facility record. The study is defined from the Area Coverage Setup form:
Note that all values in this discussion are for illustration purposes only. You should determine the appropriate values for your system.
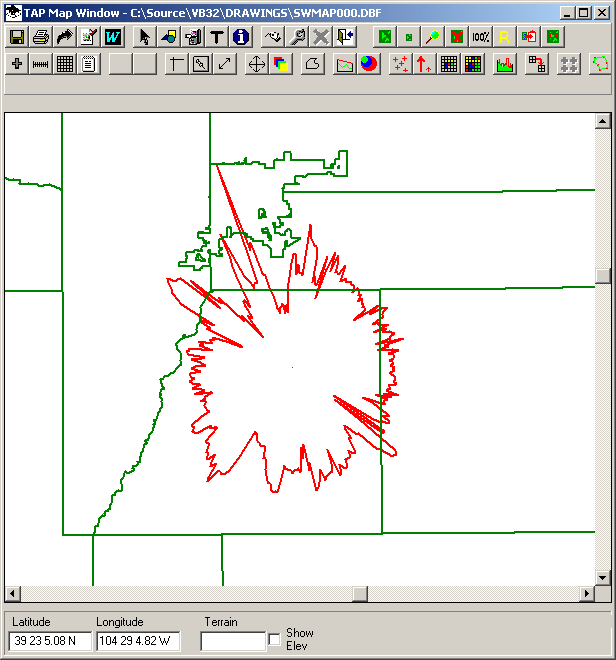
When you run and plot the study, the contour for the talk-out area is shown:
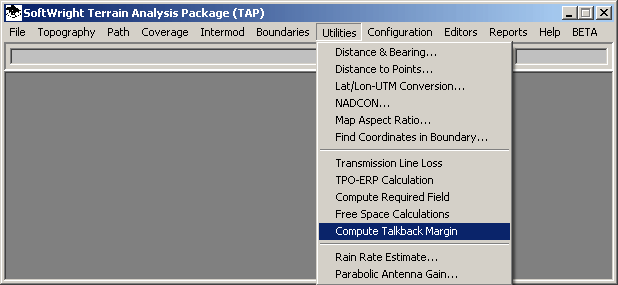
The Talk-Out Margin function is selected from the Utility menu:
Talk-Back calculations are computed in TAP by comparing the "base TX to mobile RX" system with the "mobile TX to base RX" system. The net difference between the systems, or the "talk-back margin" is used to determine the talk-back area based on the computed values for the talk-out study.
The TalkBack System Margin form facilitates the margin calculations:
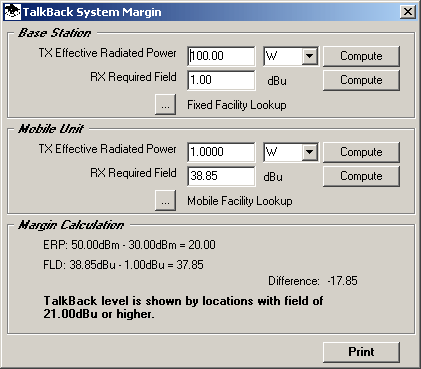
There are several options for filling in the values on the form:
The Print button on the form can be used to create a simple ASCII document with the data from the form:
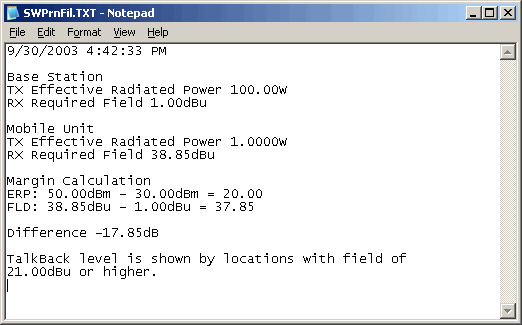
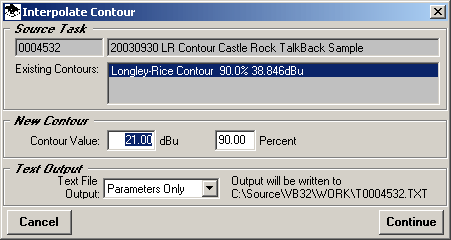
When the Talk-Back level is determined based on the ERP and Required Field values for the base station and mobile unit, a new contour can be computed to represent the Talk-Back area.
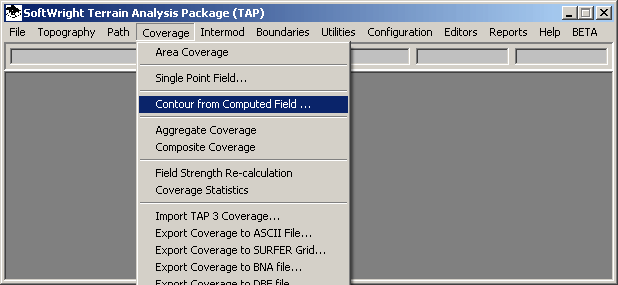
In the example above, the Talk-Back area will be represented by the 21dBu contour. You can use the Contour from Computed Field function in the Coverage menu.
The Contour from Computed Field function uses the radial field strength values already computed for the study to interpolate a new contour value.
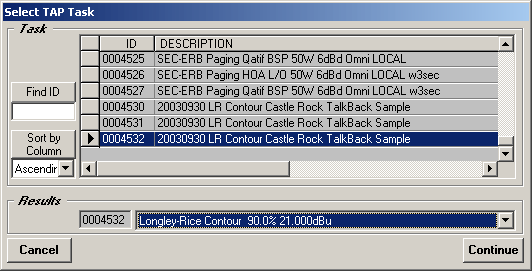
You will be prompted to select the radial study to use for the new contour. Be sure to select the same study computed for the Talk-Out study.
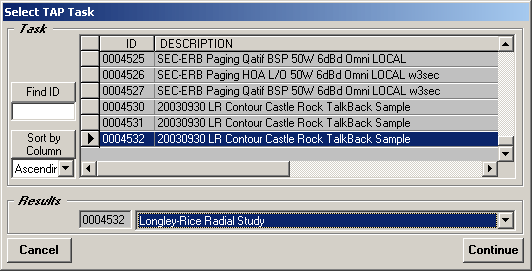
Note that the Task will probably include the original radial study, as well as one or more contour studies previously computed from the radial values. Be sure to select the radial study to compute the new contour.
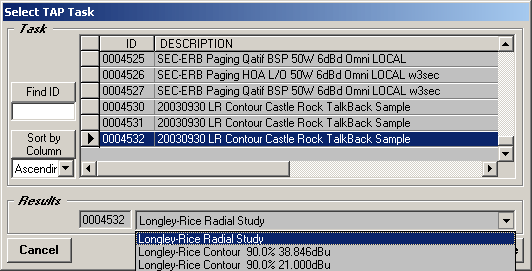
A warning message will be displayed if you select an contour study.
After the radial study is selected you will be prompted for the value of the contour to compute. In this example, you would enter 21.00 dBu for the new contour.
The contour will be interpolated in much less time than recomputing all the radial values.
You can then plot the new (Talk-Back) contour as any other TAP contour. Use the File-New Map menu:
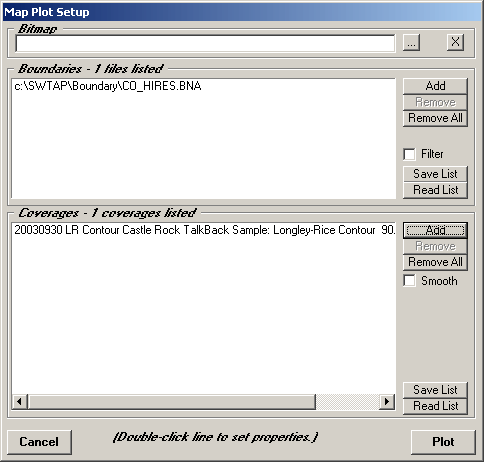
In the Coverages section of the Map Plot Setup form, click the Add button, and select the Task and the contour to plot:
When the contours you want to plot are listed, click the Plot button:
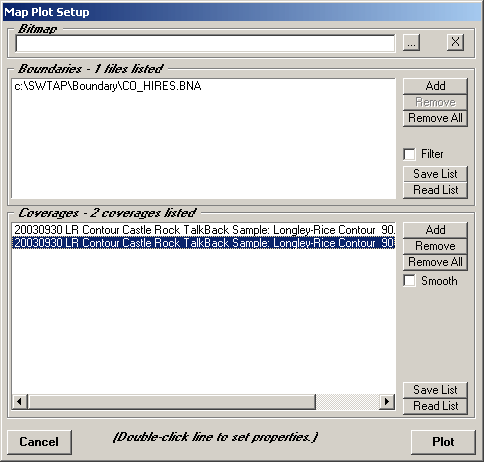
The Talk-Out and Talk-Back contours can be plotted on the same map. In this example, the red contour represents the Talk-Out area, and the blue contour represents the Talk-Back area.
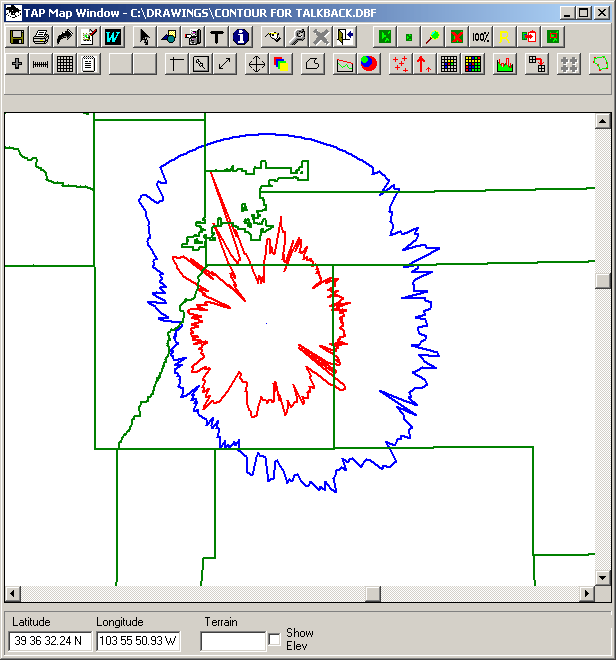
This plot illustrates a couple of interesting factors for the contour coverage calculated with TAP:
Remember that all values in this discussion are for illustration purposes only. You should determine the appropriate values for your system.
|
|
Copyright 2003 by SoftWright LLC