Q: How can I add a scale and legend of field strength levels on a coverage map so they don't cover any of the map itself?
A: With TAP 4.4 and later, the TAP Page Layout function includes the ability to add a scale and/or a legend of field strength values outside of the map itself. This has the advantage of being able to standardize the page layout for multiple coverage maps. Once the layout is set up, every map using that layout will automatically place the scale and legend information on the printed copy.
You should review the basic page layout functions of TAP described in the FAQ entitled "Page Layout".
After you have computed an area coverage in TAP, you can plot the coverage(s). In the following example, the map includes a radial study showing field strength levels at locations along the radials from the transmitter site, and a contour interpolated from those values.
When the coverage map is drawn on the screen, click the Print button to print the map. TheTAP Graphic Window Print form is displayed:
Click the Layout button in the lower right portion of the form to open a list of available layout templates:
Note a change in TAP 4.4 from earlier versions. The Page Layout Templates are now grouped by page orientation and size (8-1/2x11, Landscape in this example). This means you can use the same template on any printer set for that page size and orientation.
You can create a New template, or select and edit and existing template. For this example, click the New button:
A new entry is added to the list of templates. (The file name in the right column is generated automatically by the program.) You can give a name to the new template to identify it:
Once the template you want to use to add the scale and legend is highlighted (click the selection button to the left of the line), click the Edit button to edit the template.
The TAP Page Layout edit form is displayed:
Initially, the shaded area on the page (representing the area for the map plot) is shown with half-inch margins. You can set the margins numerically by entering the desired values, or you can use the mouse by clicking the "Set Margins w/ Mouse" button.
To add the information about the coverage to the template, click the Task Info button. This will allow you to draw a box on the page where you want to print information such as the transmitter site coordinates, power, propagation model, etc.
(Note that if your coverage map includes multiple studies from different transmitter sites, using different propagation models, etc., only the first study plotted will be listed in the Task Information Area.)
To add a legend of field levels and contour values, click the Legend button. This will allow you to draw a box on the page where you want to show the color and fill for field strength levels for radial or tile studies, and the color and line type for contours.
To add a scale to the template, click the Scale button. This will allow you to draw a box on the page where you want to position the scale. (You will also be prompted to select the units (miles, kilometers, nautical miles) to include on the scale.)
As you move the mouse over the areas of the template, a reminder is displayed at the bottom of the form describing each of the areas:
You can use the Add Text button to add the text, such as a company name and address, copyright information, etc.
Close the Page Layout edit form by clicking the X in the upper right corner, then close the Page Layout Templates list. On the TAP Graphic Window Print form, the selected Page Layout description is displayed.
When you click the Print button, the coverage map will be printed with the specified layout information:
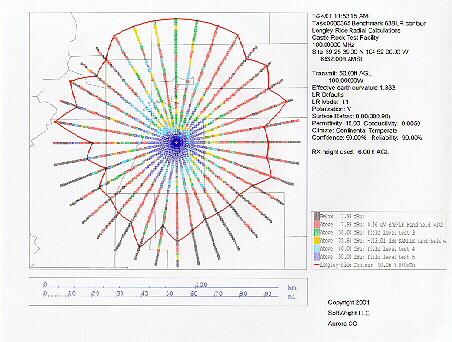
Copyright 2001 by SoftWright LLC