Multiple Level Plots for Coverage
Q: I want to show several levels of signal on a coverage map, but the program only lets me define one level. Plus, the color and cross-hatch information I want to use only shows up as black. What is the problem?
A: It sounds like you have a box checked on the Levels form that needs to be unchecked.
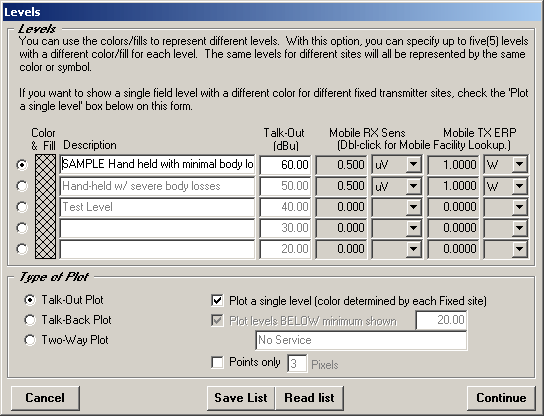
In the lower part of the form there is a check box labeled "Plot a single level.…" If the box is checked, your Levels form looks something like this:

The use of that box is explained in more detail in an article about Coverage Plots for Multiple Sites.
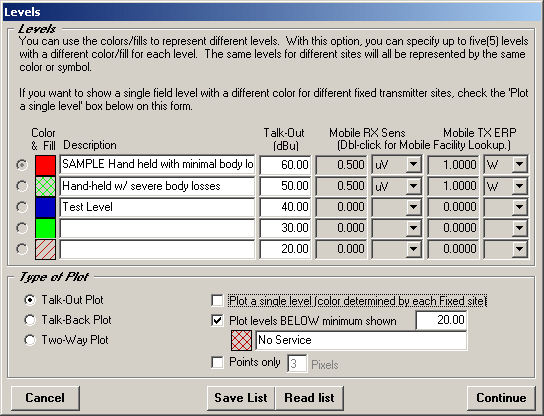
The short answer is that if you want to show different colors for different signal levels (that corresponding to the required field for different radios or different situations), that box should be un-checked:

With the box un-checked the color information you specify will represent different levels for the studies you select on the Map Plot Setup form under Coverages. For example, if you have studies from several different base stations on the same plot the colors will represent the signal levels without any distinction between different transmitter sites.
On the other hand, if you want to plot a single level and see that level from Site A in red, Site B in blue, etc., then you check that "Plot a single level" box on the Levels form. This is explained more in the FAQ mentioned above.
If you un-check that box on the levels form you will be able to get the plot you want.
Copyright 2003 by SoftWright LLC