Q: How can I make the coverage contours computed and drawn with TAP appear smoother?
A: Several factors affect the appearance of field strength contours in TAP.
Propagation Model
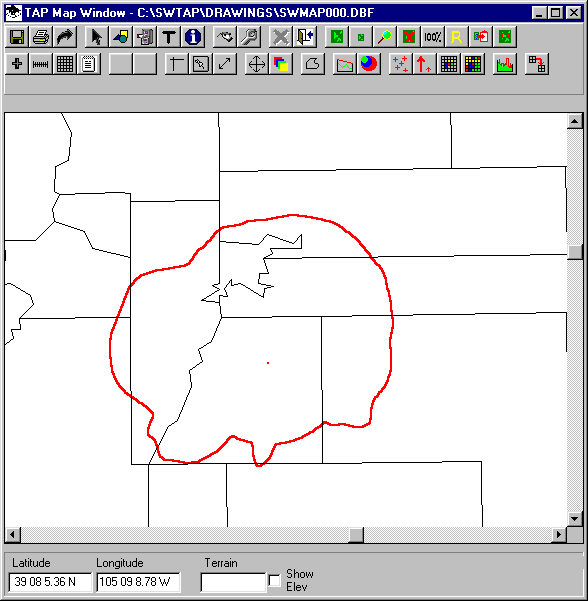
The type of propagation model used will often affect the smoothness of a contour. For example, "statistical" models, such as the Broadcast, SMR, or Carey models that use an HAAT value on each radial will often tend to be smoother, since the differences in the topography on adjacent radials are literally averaged out.
For example, here is a simple contour computed with the Broadcast propagation model:

On the other hand, "analytical" models, such as Bullington, Longley-Rice, or Okumura use specific detail of the topographic data along each path, so the differences between the distance to contour on different radials can vary dramatically.
If the same parameters are used to compute the coverage with the Longley-Rice model, the contours can be compared:
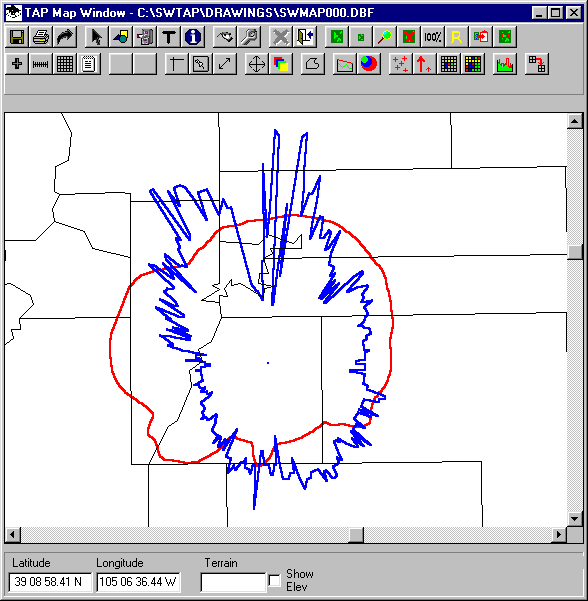
The comparison shows the difference in the predicted area of the two models, as well as the more noticeable changes from one radial to the next in the Longley-Rice calculation. The "jagged" nature of the contour is a representation of the differences of the topography along the paths and their effects on the way the model computes the field.
Number of Radials
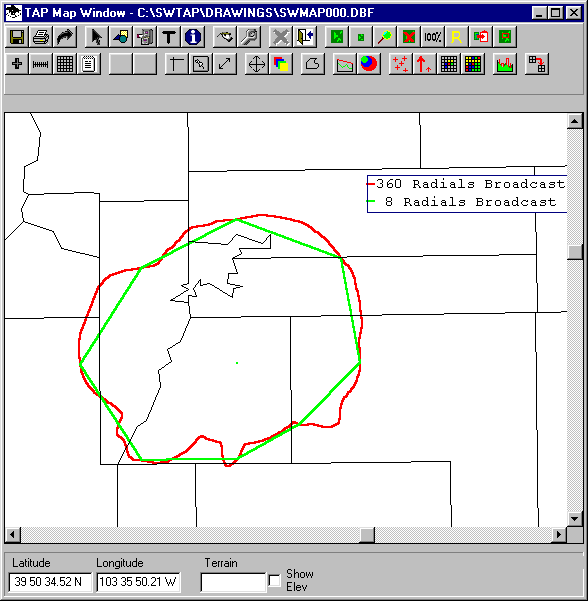
The number of radials used for the contour calculation will also affect the smoothness of the contour. Both of the examples above were computed using 360 radials (every one degree around the transmitter site).
The same coverage can be computed, for example, using the Broadcast model and only eight radials:
The same comparison can be made with Longley-Rice contours computed on eight radials and 360 radials:
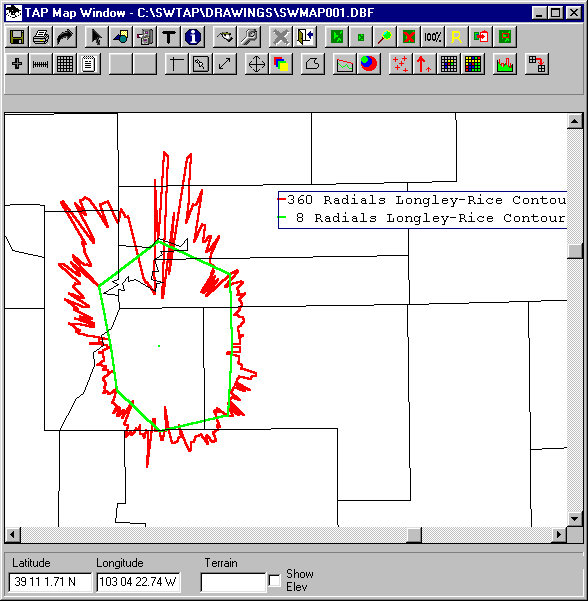
In this example, the difference between the coverage based on the number of radial is quite dramatic. Remember that with only eight radials, all information between the radials is ignored and the eight computed points are connected by straight lines.
Contour Smooth Plot Option
Another option available in TAP 4.1 and later is the "Smooth" option on the Map Plot Setup form:
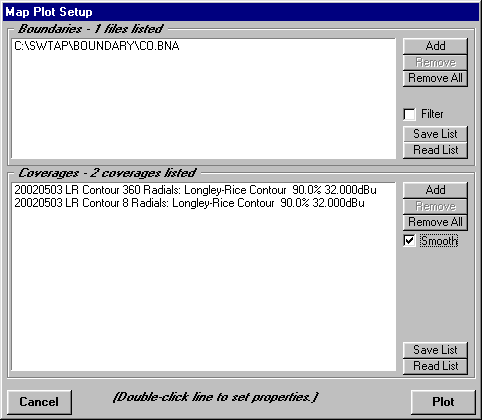
When one or more of the Coverages listed is a contour, the Smooth box is displayed. If you check that box, the program will plot the contour(s) using a smoothing algorithm defined by FCC Docket 90-6, Item 28, to do a linear interpolation of the distance to the contour on the azimuths between the computed azimuths.
For example, the result using the Longley-Rice contours in this example results in a coverage map as shown:
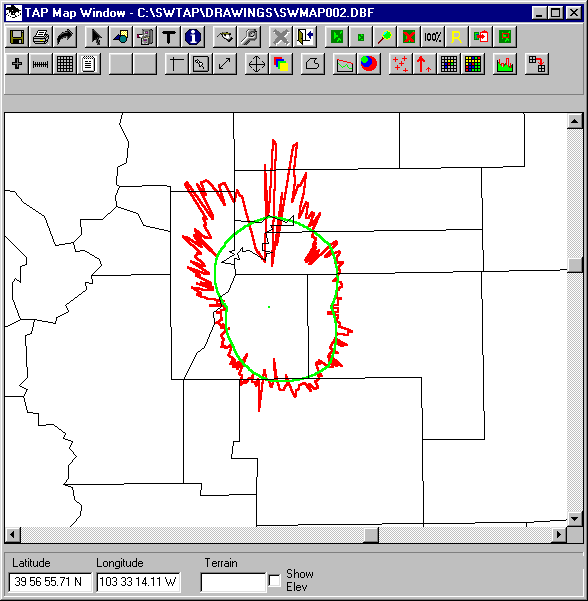
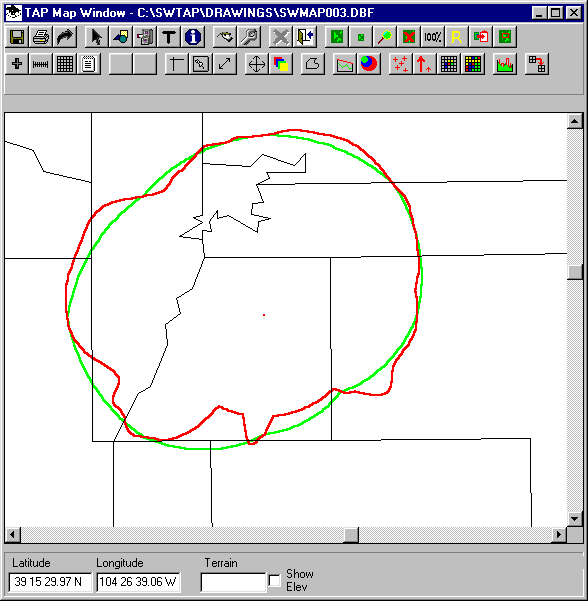
In this example you can see the effect on the contour using only eight radials is much more significant. On the contour using 360 radials, the interpolation between adjacent radials (i.e., between azimuth 45 and 46) is negligible. But on the eight radial contour, the interpolation between azimuths 45 and 90 shows a significant difference from the straight line in the "un-smoothed" contour.
Finally, to show the effect of smoothing on the statistical models, such as Broadcast, the map using the eight and the 360 radial contours from the Broadcast study is shown below:
Copyright 2002 by SoftWright LLC