HDMapper™ Color Settings
Q
A: With HDMapper you can set an entire layer to a single property setting for color, line width, etc., or you can set the properties to reflect a value in the ShapeFile database.
(This article discusses property settings for typical ShapeFiles. Another article describes setting color and other properties for TAP Field Strength Coverage studies.)
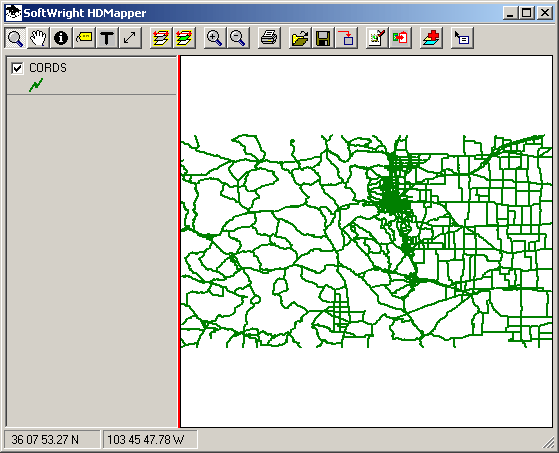
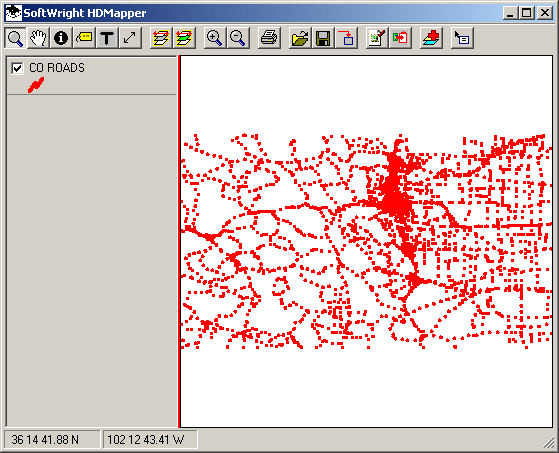
For example, suppose you have loaded a ShapeFile of roads as shown below:
If you want to change the properties for drawing that layer, double-click the legend entry for the layer to the left of the map. The Layer form will be displayed:

The form shows the current setting of the layer: a single symbol (a green line) for the roads.
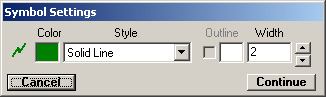
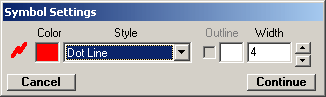
If you want to change the properties for the layer, double click the symbol on the form. The Symbol Settings form is displayed:
Click the Continue button to return to the Layer form:
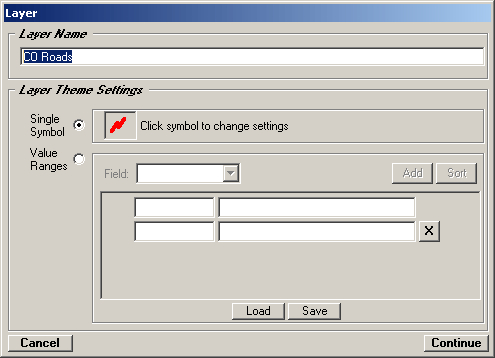
Note you can also change the description of the layer (the description is displayed on the legend).
Click the Continue button to return to the map.
Some ShapeFile data values (as well as coverage study field strength values) can provide additional information on maps by setting different symbols for values in the file.
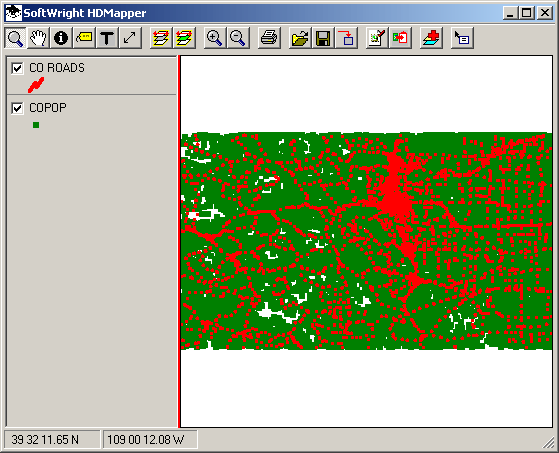
For example, suppose you also show the population information from a ShapeFile.
Double-click the population layer in the legend to open the Layer form again.
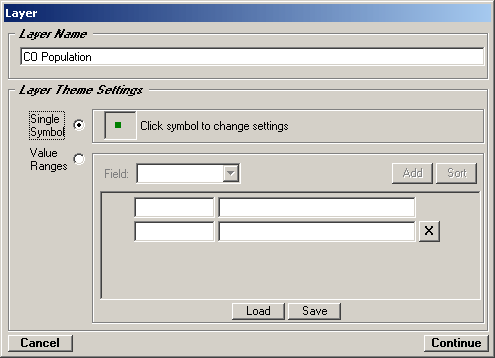
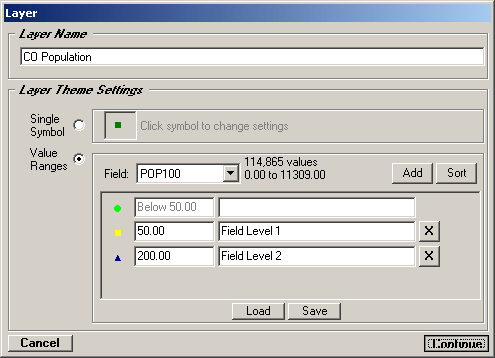
Select the Value Ranges option instead of the Single Symbol option:
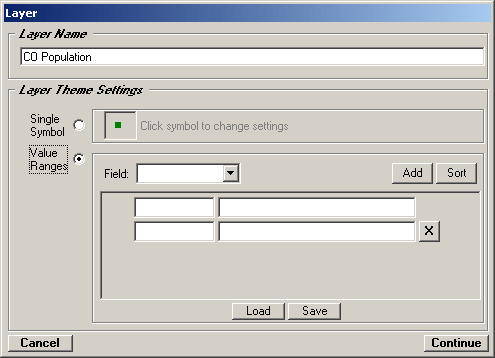
Click the pulldown Field list to see the available data values or "fields" in the ShapeFile database:
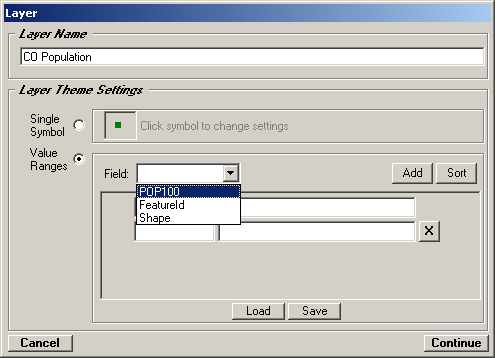
ShapeFiles can have a wide variety of fields in the associated database. The fields in the database will depend on the ShapeFiles you are using.
In this example, select the POP100 field.
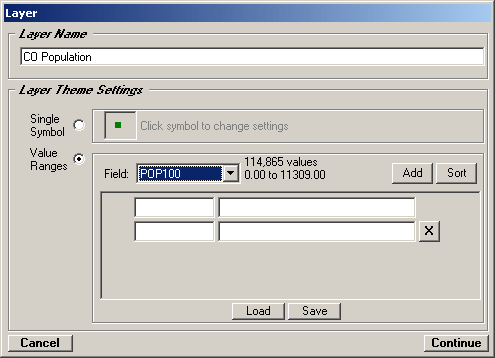
When the Field is selected from the list, the program reads the database and displays the number of values and the range of values in that field:
Click the Add button twice to add two settings for the "breakpoints" to be displayed for the POP100 field:
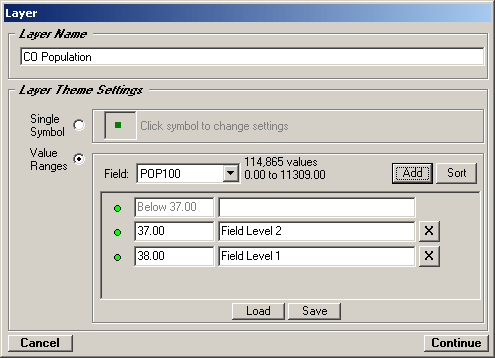
Initial values for the symbol and the numeric values are displayed.
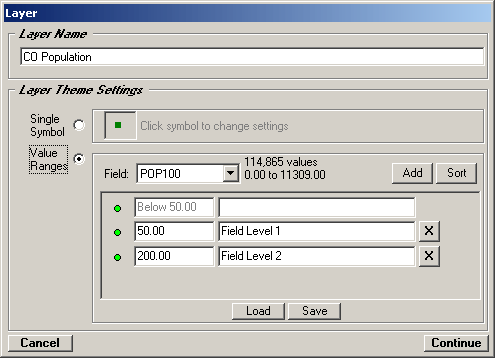
You can change the numeric values for the break points. For this example, change the values as shown below:
Double-click the symbols to change the properties used to plot each level of the values:
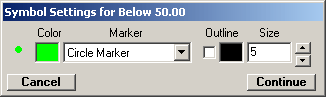
Note that un-checking the "Outline" option usually results in a better plot. When zoomed far out in the map, a large number of points will be closely grouped together and the outline can interfere with the ability to read the map symbols.
Set the symbols to the settings you want, then click the Continue button on the Layer form:
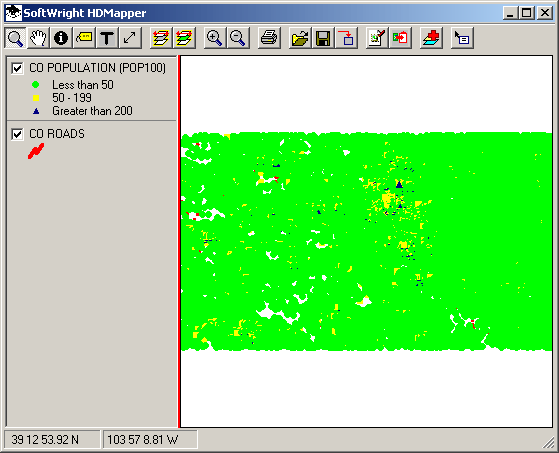
The new settings will be shown on the map:
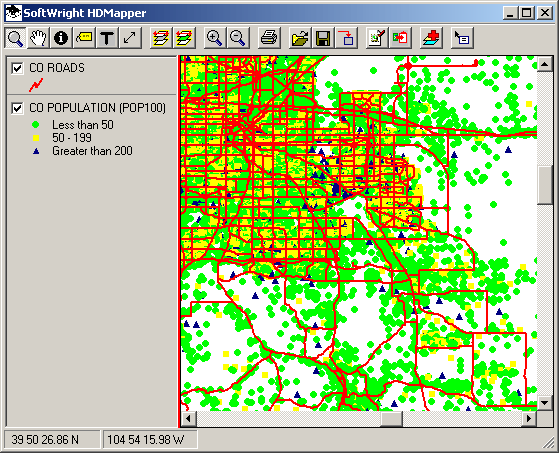
Moving the Roads layer to the top of the legend list, and changing the roads to a solid line will make the map more readable when you zoom in to see the detail:
|
|
Copyright 2004 by SoftWright LLC