SRTM Data Values
Q: Since the SRTM (Shuttle Radar Topography Mission) data was collected with radar imagery, do these values include building heights?
A: The SRTM data is described on the JPL/NASA web site:
Did the radar sample the tops of trees or the ground level?
The radar does not "see" through thick vegetation canopies. It probably penetrated a little way into some canopies, but in general it followed near the top of the canopy.
Did the radar signal bounce off treetops, or topography, or some combination of both that will provide separate data sets (geodesists like myself care about topography, whereas scientists more interested in forestry care about the height of the canopy).
Unfortunately, the wavelength used, 5.6 centimeters, didn't penetrate vegetation very well. That means, for moderate-heavy vegetation, we mapped near the canopy top. We did penetrate a little, as some studies comparing our technique with laser altimeters showed, but not to the ground. If the vegetation was sparse, or had no leaves, we might get a return from the ground. The Vegetation Canopy Lidar, scheduled to fly as part of the Earth Observing System, will have this capability, which may provide some interesting data-set comparisons.
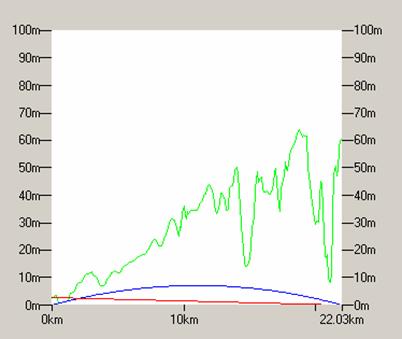
As an example, the following profile shows a path from the southwest to the northeast through Manhattan in New York City. This profile uses USGS NED (National Elevation Dataset) elevation values:
The same path drawn with SRTM data shows significant differences:
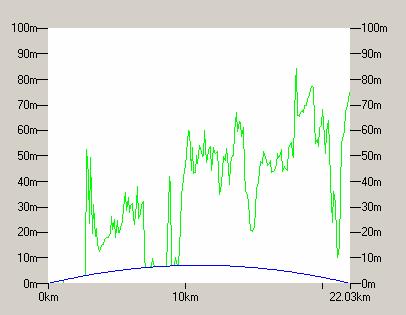
The peaks or spikes are clearly visible, probably indicating buildings. The SRTM data may also contain voids (areas of missing data – see the JPL/NASA website), as seen in the region between about 8 and 10km.
When using SRTM data with TAP land-mobile rf coverage studies, since the SRTM data already includes building or vegetation heights, the use of Surface Feature files is usually not necessary. Also, be aware that when TAP calculations are based on a mobile unit with an antenna height specified above ground level, the “ground level” from the SRTM topographic data files is actually the “canopy” including building heights, etc. The result is that computed field values in areas with buildings or vegetation will often be overly optimistic (i.e., higher than real life values). For example, with a mobile antenna elevation specified as 6 feet above ground level (AGL), the calculations will actually be performed with the antenna six feet above the SRTM values (which may include buildings or vegetation). The computed field strength value will be higher than would actually be found with the mobile antenna located six feet above the true ground elevation. Should these predicted values be excessively high, you would need to carefully evaluation the path study for received signal level. This potential discrepancy results from the way the data was collected – the top of the surface (including surface features) NOT the ground level elevation as has historically been the case in previous digital elevation models.
|
|
Copyright 2005 by SoftWright LLC