Q: The legend shown on my coverage plot shows the field strength levels in dBu. How can I show the values in dBm?
A: TAP computes coverage as values of field strength (in dBu, or dB above one microvolt per meter). This enables you to plot the coverage using different colors or fill patterns to indicate different levels of field strength. The levels plotted are typically used to show the coverage areas for different receiver configuration(s).
(A more recent and more detailed article is available for "Plotting Coverage in dBm.")
The receiver configurations include the antenna gain, as well as losses (transmission line losses, body losses, building losses, etc.) associated with particular hardware and conditions. Using TAP to compute the field makes the coverage calculation independent of these variables. Therefore you can plot any number of different receiver configurations without having to recompute the field strength coverage. (The main exception to this approach is the mobile receiver antenna height. If the antenna height changes, this changes the geometry, path clearance, etc., of the calculations and a new field strength coverage study must be computed using the new antenna height.)
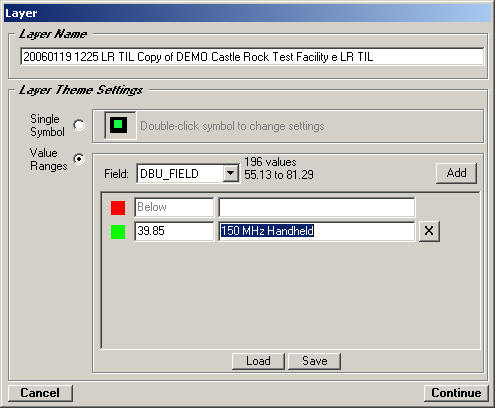
You can set the levels you want to plot as described in RF Field Strength Levels with HDMapper. As describe in that article, you can set level values, colors and descriptions manually, or from the Mobile Facility database.

You can enter the label you want to display on the map. If you include the dBm value or other information in the Mobile Facility description, that text will be automatically used when you double-click to get the Mobile Facility record.
However, you can also specify a receiver sensitivity value, either by entering the value directly, or by double-clicking to look up a value from the Mobile Facility data base:
|
|
Copyright 2000 by SoftWright LLC