Plotting Coverage in dBm
Q: How do I show my coverage maps using dBm instead of dBu?
A: TAP computes coverage as values of field strength in dBu, (a standard abbreviation for dBuV/m, or dB above one microvolt per meter).
Note that all values in this example are for demonstration purposes only. You should determine appropriate settings for your application.
This article will describe how to show coverage levels in dBm for a particular mobile receiver, but first it will be helpful to understand the value of field strength predictions in dBu.
Computing coverage for a large target area in field strength instead of receiver input power gives you great flexibility and efficiency. But you can also use those computed results to display input power (in dBm) or input voltage (in dBuV) as described below.
Think of an area coverage study as a large number of point-to-point studies, from the base station to tens or hundreds of thousands of locations for a mobile unit. Ultimately we need to know the input power to the mobile receiver in order to determine the success or failure of communicating to that location. (This discussion looks at the base-to-mobile communication circuit, or the “talk-out,” but the same principles apply to the mobile-to-base circuit, “talk-back” or “talk-in.”)
That receiver input power is based on all of the factors in that communication link:
The transmitter power output (TPO) and all the gains and losses at the base station transmitter
The loss along the path to the particular location (free space loss and obstacles on the path)
The gains and losses for the particular mobile unit, including the hardware (a handheld or vehicle radio, a pager in the users pocket), and the immediate environment at the location (building and body losses, rf noise, etc.)
Computing the mobile receiver input power by considering all these factors will provide the information we need for that particular receiver hardware and local environment. Then we can compute another study to see the results using a different mobile configuration (such as a higher gain antenna on the handheld, changing the predicted building losses in the area, etc.). Then a third study can consider other changes to the mobile arrangement.
But TAP™ uses a better approach.
If the base station parameters (antenna pattern, effective radiated power, etc.) remain the same, then at each location in our area coverage study, the field strength, or the amount of energy available at each location, remains constant (expecting that the terrain and buildings also stay the same – usually a reasonable assumption).
Then the only variable is the different types of mobile hardware we expect to use for that service area, and the "required field" level necessary for that configuration. That means that we should be able to compute the field strength for the area once (very efficient) and then determine if that field strength is adequate for each of the possible mobile configurations (very flexible).
And that is what TAP does, by first computing the field strength (in dBuV/m, abbreviated "dBu") at each of the thousands of locations. For each location, the program determines the receiver input power level (in dBm) available to any combination of hardware and environmental losses is computed from that field strength value. The results on a coverage map can show the predicted service for several scenarios of mobile hardware and environmental conditions, all from running a single coverage study.
Suppose you have a particular mobile unit with the following specifications from the manufacturer:
|
Antenna height: |
6ft Above Ground Level (AGL) |
|
Operating frequency: |
155MHz |
|
Required receiver input power: |
0.7uV (-110dBm into 50 Ohms) |
|
Antenna Gain: |
0dBd |
|
Internal losses: |
0.1dB |
In the TAP Mobile Facility database, you can create a record for this handheld:
Note that the antenna height for mobiles is entered in the Transmitter Antenna section. Mobiles are assumed to have a common antenna for both transmitting and receiving.
(The Mobile Facility database can be opened from the TAP Editors menu, or on the right side of the HDCoverage form, or from several lookup functions in TAP.)
You can scroll down or collapse sections of the Mobile Facility interface to enter the other parameters:
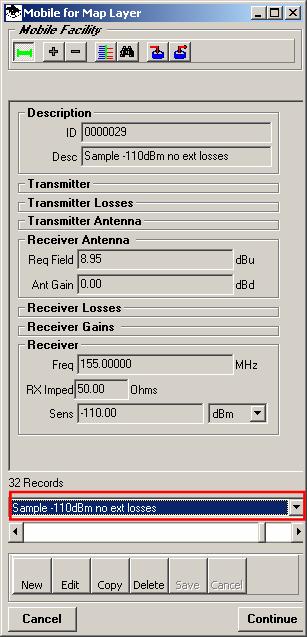
When you have entered the frequency, impedance, and sensitivity information, the program will compute the “Required Field” value:
The “Required Field” in dBu is the amount of field strength needed for this sample mobile receiver. In other words, with a 0dB gain antenna, 0.1dB of internal losses, an impedance of 50 Ohms and operating at 155MHz, a field strength of just under 9dBu is required to deliver the manufacturer’s specified –110dBm of power into the receiver.
It will be helpful to include more information in the description for this Mobile Facility record. Since no external losses (such as body or building losses) are included, that notation can be included in the description):
Now the description indicates that this record represents -110dBm receiver input with no external losses.
With all of the desired information entered click the Save button to save the record.
You can use the same process to create additional Mobile Facility records for other dBm power input levels of interest to you. (Note that this function has been automated in TAP build 2236 and later.)
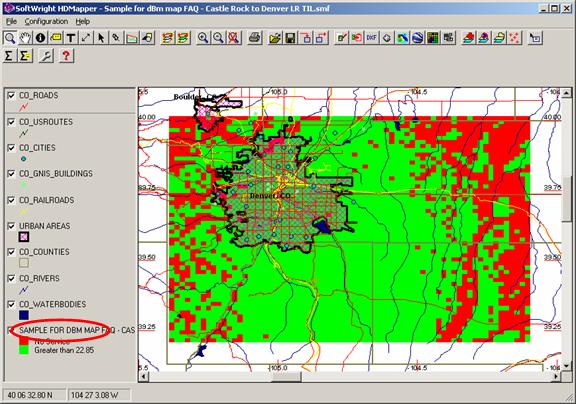
Now when you plot a coverage study in HDMapper, you can select the coverage levels from the records you created representing the desired dBm power input levels.
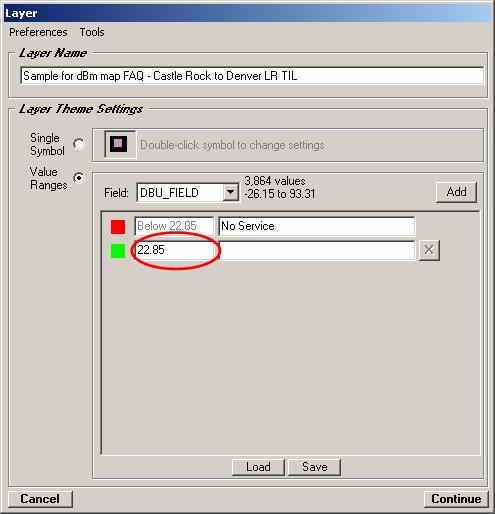
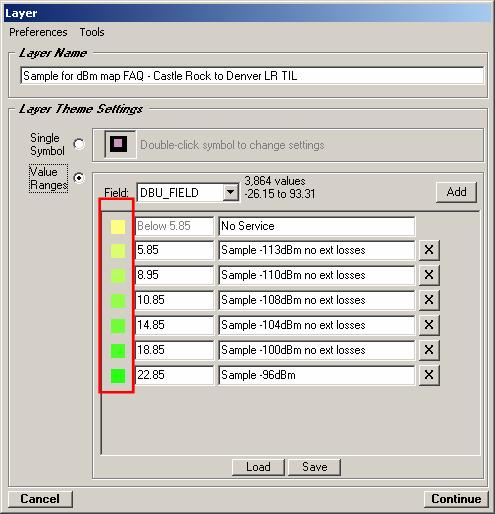
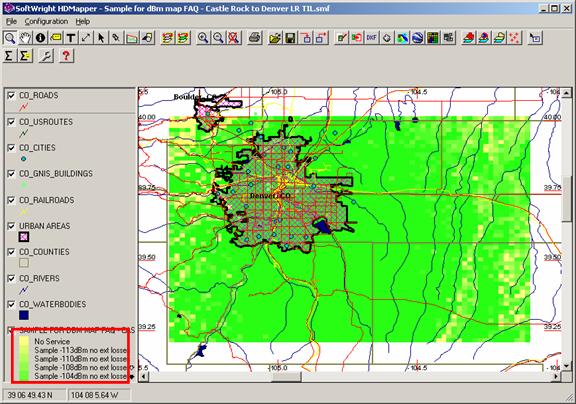
For example, suppose you have computed a coverage map as shown. Double-click the coverage layer legend entry to set new level values to display:
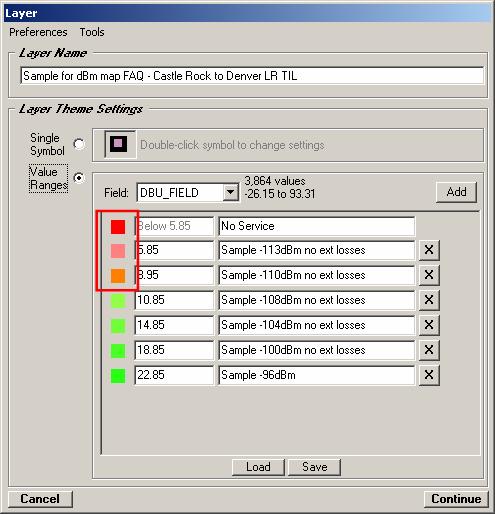
The Layer properties form will be displayed: Double-click the field strength (dBu) value to open the Mobile Facility database:
When the Mobile Facility database interface is displayed, use the pulldown list near the bottom to select a dBm level record you want to use to display that level:
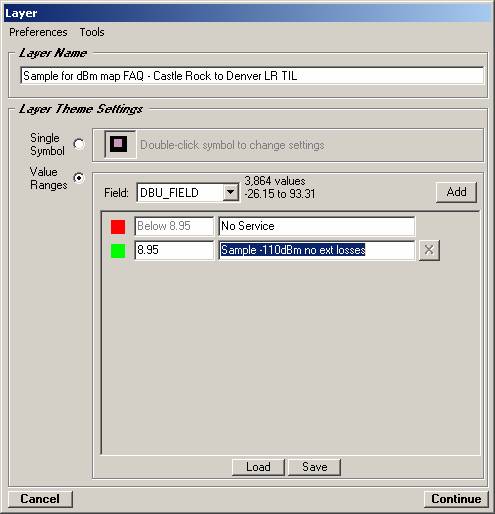
Click the Continue button to select the Mobile Facility record. The information is returned to the Layers properties form:
If you want to show additional layers, click the Add button:
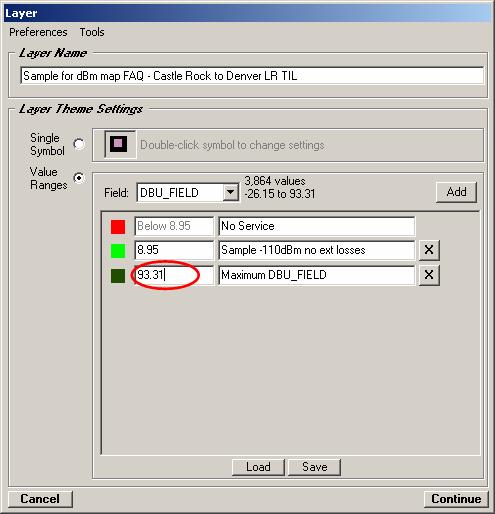
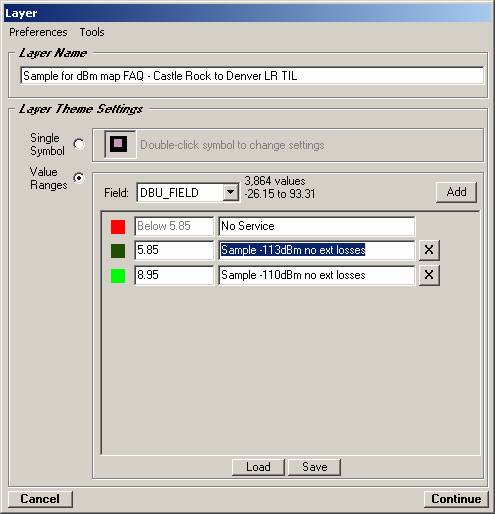
When the new level is added, double-click that value to lookup another Mobile Facility record:

The new level is automatically sorted into the correct order:
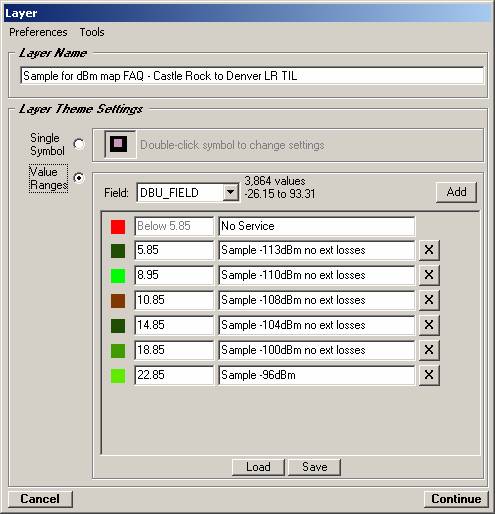
Repeat the process to create as many power levels as desired to show on the map:
You can use the Tools menu and select “Set Range Colors” to create a gradient of colors for the selected levels:
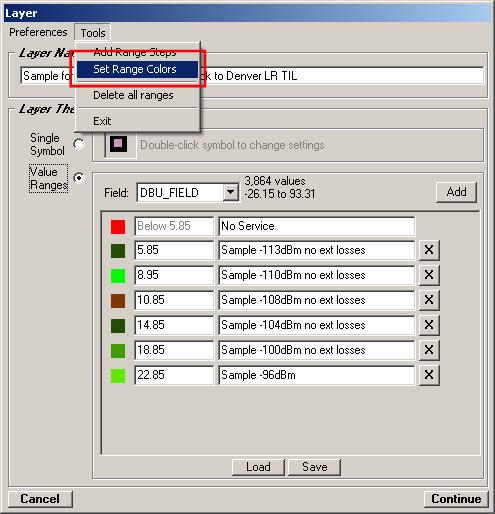
When you click “Set Range Colors” the Colors form will be displayed:
You can click the High or Low labels to change the colors. When you have the colors desired, click the Continue button. The new color settings will be applied to the selected levels:
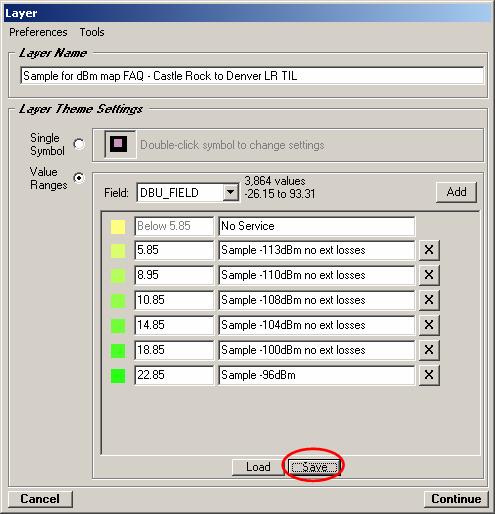
If these settings may be used in the future, you can save the layer settings (color, values, descriptions) by clicking the Save button near the bottom of the form.
You will be prompted for a name to use to save the template information for these layer settings. Enter a name that will be useful to you later to find the settings:
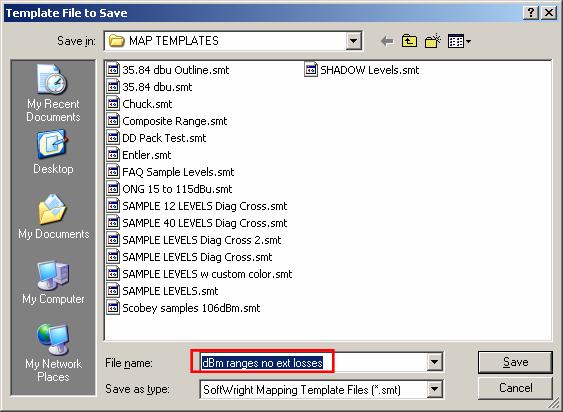
Click the Save button to save the settings.
To load the settings again in the future, you can click the Load button near the bottom of the Layers properties form.
Click the Continue button on the Layer form to return the new settings to the map, with the dBm power levels shown in the legend:
You can also return to the Layer form (by double-clicking the legend for the layer) to change the settings. For example, if you want to differentiate levels that are at or below the manufacturer’s input power specification, you can double-click the symbol to the left of the level line to select an individual color for that level. When you have set the individual level symbols as desired, click the Continue button.
The new settings will be returned to the map.
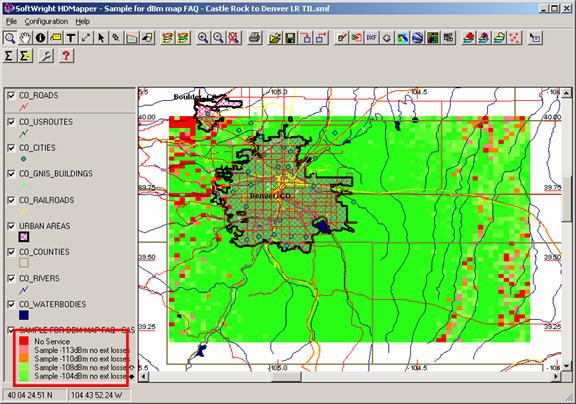
Other changes can be made to customize the map presentation.
Remember that the power level settings are only valid for the conditions specified, a particular receiver with its associated antenna gain and internal losses, and assuming no building or body losses in the immediate vicinity of the mobile location.
|
|
Copyright 2008 by SoftWright LLC