Multiple Overlapping Contours
Q: I want to do a population count involving a service contour and multiple interfering contours. How do I do that in HDMapper?
A: With TAP6.0.2354 or later and a Maintenance Subscription date of September 30, 2010, or later, you can merge the multiple interfering contours into a single shapefile to use in HDMapper with the population count function.
Note that all values in this example are for demonstration purposes only. You should determine appropriate settings for your application.
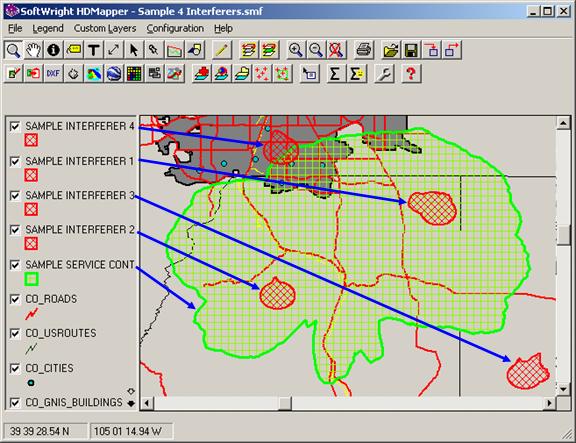
For example, suppose you have computed a service contour and four potential interfering contours with separate studies in HDCoverage. You can draw a map of one of the contours, then add the coverage shapefiles computed for the other contours as shown below:
You can use the “Zoom to Coverage Layers” function to be sure all the coverages are being displayed on the map.
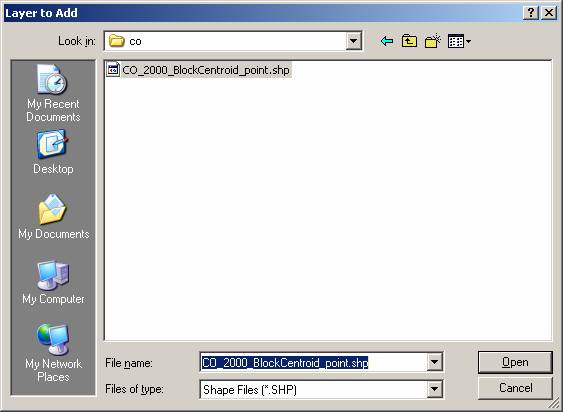
You can add a population point layer as required by the HDMapper Population Count function, such as the “CO_2000_BlockCentroid_point.shp” shapefile:
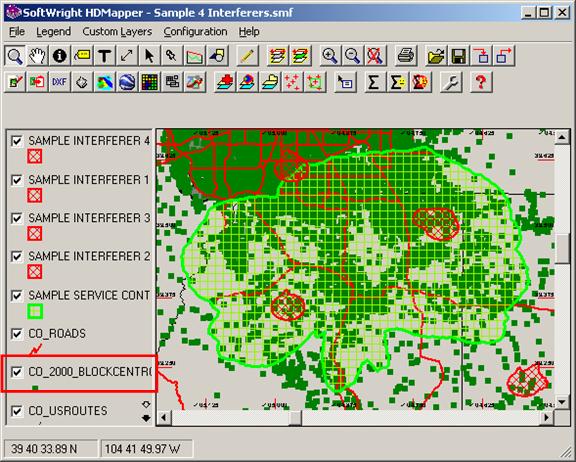
The population centroid points will be displayed on the map.
Click the button for “Intersecting Contours Pop Count” on the HDMapper toolbar:
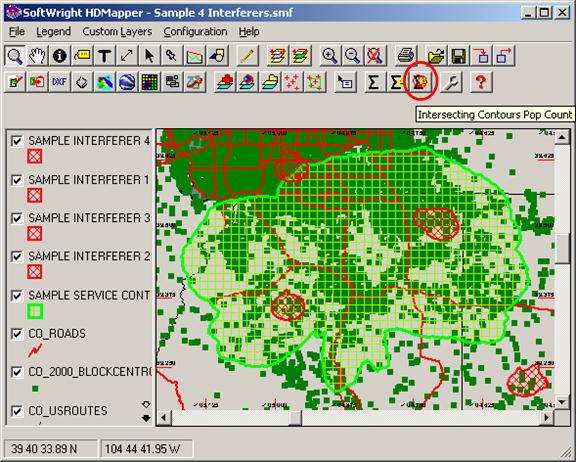
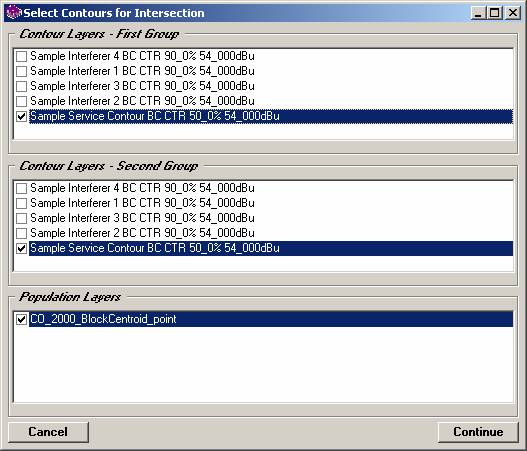
The form is displayed to “Select Contours for Intersection” showing all of the computed coverage contours and population layers on the map:
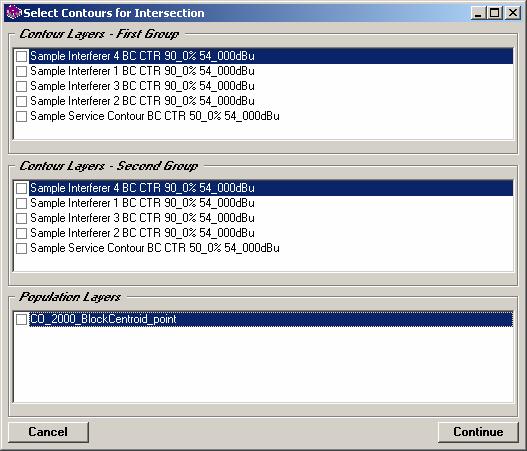
For the two groups of contours, each lists all the contours on the map. The intersection is computed between any of the contours you select in Group 1 and those you select in Group 2.
For example, if you want to find the population in the intersection of the one “Sample Service” contour shown, and any of the four “Sample Interferer” contours, select the “service” contour in one group, and the “interferers” in the other group:
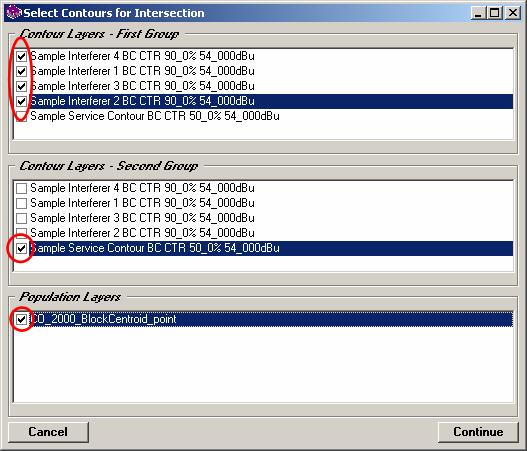
Be sure to also select at least one “Population Layer” from the map.
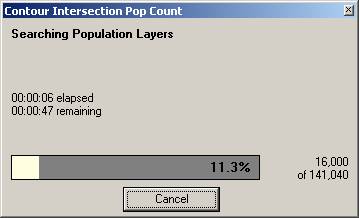
Click the “Continue” button on the form to start the population count. A progress form will be displayed:
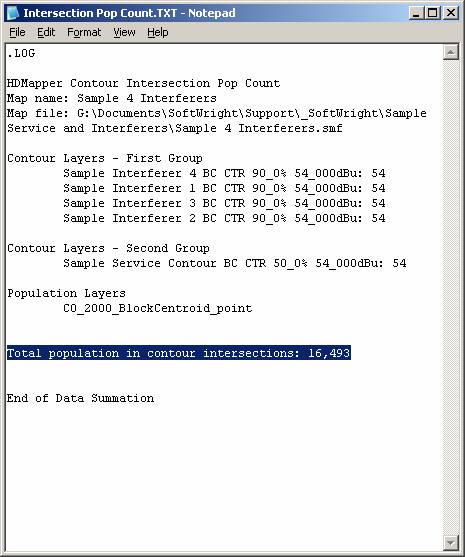
When the count is completed, a text file will be displayed with the results, including the contour layers included in each group and the population files used:
If you want another population count, for example, for just the “Service” contour, click the “Intersecting Contours Pop Count” button on the HDMapper toolbar again:
This time, select only the “Service” contour in both groups, to count only the population within that contour:
Click the “Continue” button to start that count. The results will be appended to the previous text file for the intersection pop count for the current map shown in HDMapper.
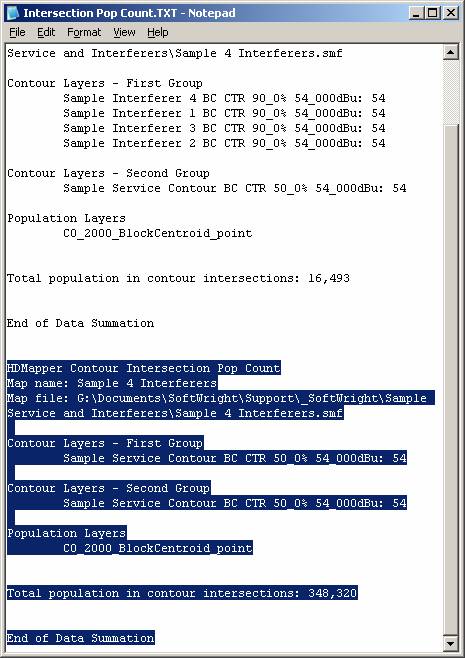
The text file is created in the folder named “CONTOUR INTERSECTION POP COUNT” in the folder where the map file is located, typically in the MAPPING folder where TAP is installed, in a sub-folder named with the Task Description specified when the coverage study was set up in HDCoverage.
|
|
Copyright 2010 by SoftWright LLC