Adding Coverage Layers in HDMapper™
Q: How do I show the results of multiple coverage studies in HDMapper?
A: The Add Coverage Layer button enables you to select a computed coverage study and add it to the map.
Note that all values in this example are for demonstration purposes only. You should determine appropriate settings for your application.
(This article describes how to add the graphical presentation of individual coverage studies to the HDMapper display. If you want to compute how multiple coverages interact, such as showing the maximum value at each location for overlapping coverages, or a best-server study for several studies, or other calculations, see the articles on the TAP Composite Coverage calculations.)
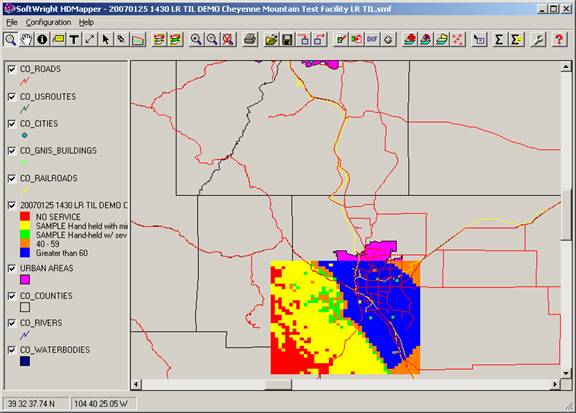
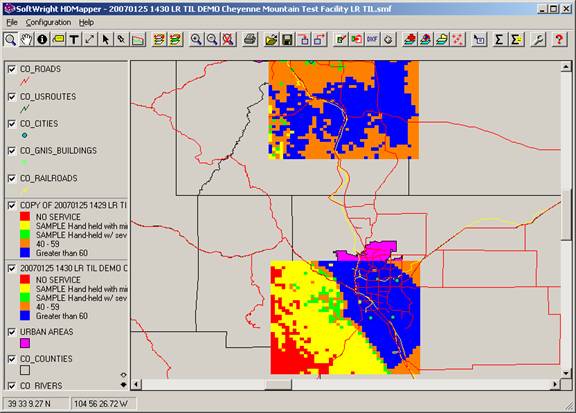
For example, suppose you have a coverage study plotted in HDMapper:
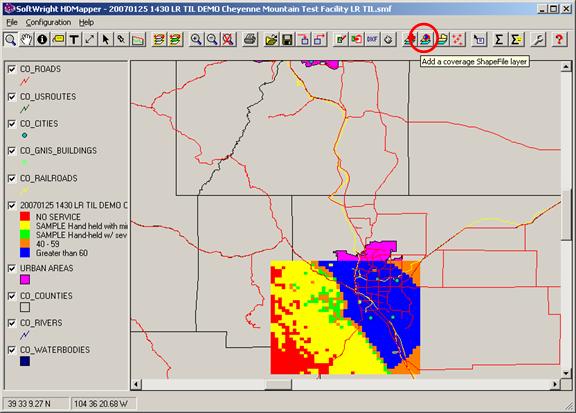
On the toolbar near the top of the HDMapper form, click the Add Coverage Layer button:
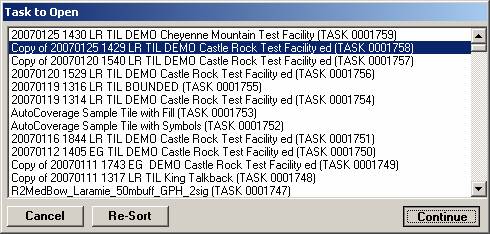
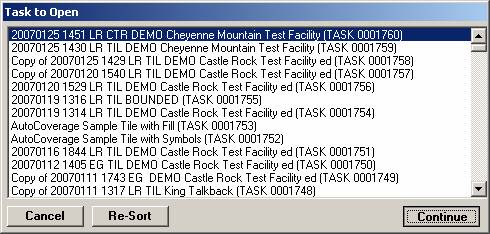
You will be prompted to select the coverage study you want to add. Select the study and click the Continue button:
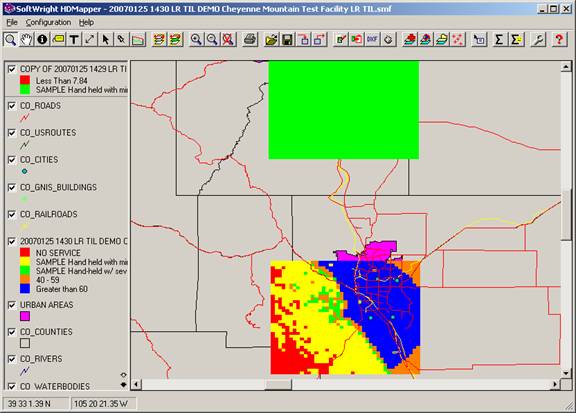
The layer will be added with the default field strength level settings:
You can move the layer in the order and change the color settings to use the same levels as the original layer in the map, or to use different level settings:

You can use the same process, starting with the Add Coverage Layer button to add a contour layer:
Select the desired study:
Then set the colors and fill for the contour as desired:
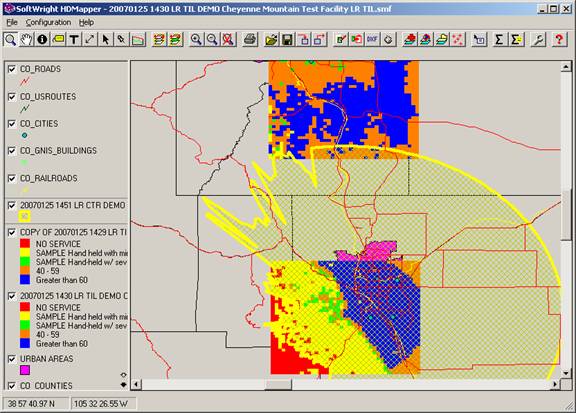
You can use the “Zoom to Coverage Layers” function to be sure all the coverages are being displayed on the map.
|
|
Copyright 2007 by SoftWright LLC