Shadow Studies with TAP™
Q: How do I compute the shadowing around my site with TAP?
A: You can use the Area Coverage Setup function in TAP just as when you run a coverage study to compute field strength.
(This article describes shadow studies with TAP5 or earlier. If you are using TAP6, please see the Shadow Studies in TAP6 article.)
While shadowing calculations are not actually a propagation model, all of the setup parameters for the study are the same as a field strength study, so the same TAP function is used. The only difference is the selection of the propagation model and the level values to plot.
To run the study, from the TAP menu click Coverage and select Area Coverage:
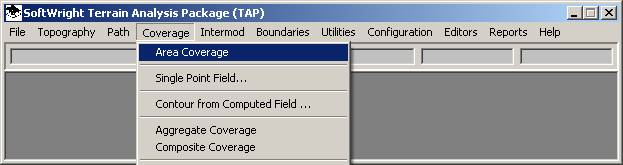
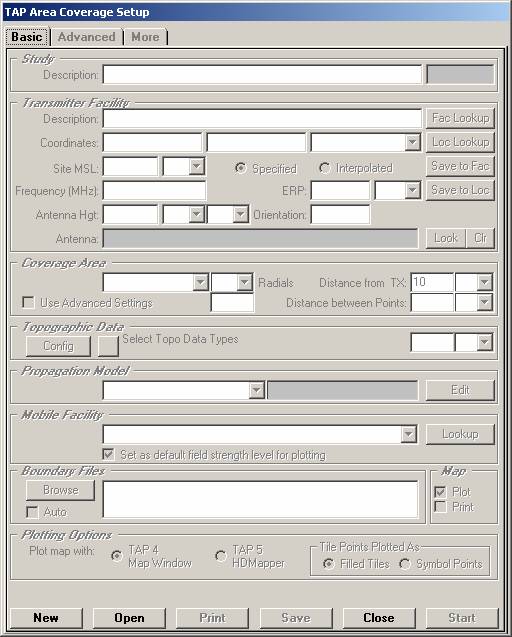
The Area Coverage Setup form will be displayed:
Study Parameters
To run a shadow study, first define the parameters you want to use (base station location, antenna height, topographic data, coverage area, etc.). These are explained in the article about the Area Coverage Setup interface.
You should include the frequency information as well, even for a shadowing study. The TAP Shadow Study function allows you to define more than just the line of sight areas. You also have the ability to define other “degrees” of shadowing, such as Fresnel zone grazing. Even when a path provides clear line of sight between the base station and the remote or mobile location, if the Fresnel zone region is obstructed, there will be some degree of signal loss. By using the Shadow Ratio Levels (discussed below) you can determine if areas with clear line of sight still may suffer signal loss. Likewise, especially for VHF systems, you can determine how badly the “blocked” areas are obstructed. This is covered in more detail below, but these Fresnel zone calculations require that you include the frequency in the base station information in the Area Coverage Setup form.
Propagation Model
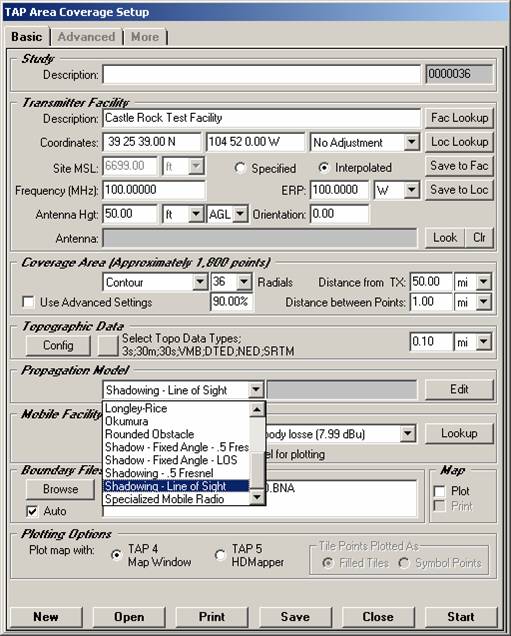
When you are running a shadowing study you can select the shadow study information on the Area Coverage Setup form in the Propagation Model section.
If your TAP system license includes the Shadow Study module, the pulldown list in the Propagation model section will include options for shadow studies:
(Note that all values used in this example are for illustration only. It is important that you determine the appropriate values for your application.)
There are several shadowing options on the Area Coverage Setup form:
- Shadow – Fixed Angle - .5 Fresnel is used for computing the half Fresnel zone clearance areas in cases where the angle between the base station and the target location is a fixed angle. This function is usually only applicable for specific applications, such as radar systems.
- Shadow – Fixed Angle - LOS is used for computing the line-of-sight clearance areas in cases where the angle between the base station and the target location is a fixed angle. This function is usually only applicable for specific applications, such as radar systems.
- Shadow –.5 Fresnel is used for computing the half Fresnel zone clearance between a base station antenna and a remote or mobile antenna at a fixed height. This function is used for most common shadow study applications.
- Shadow – LOS is used for computing the line-of-sight clearance between a base station antenna and a remote or mobile antenna at a fixed height. This function is used for most common shadow study applications.
Selecting either the .5 Fresnel or LOS study only sets the initial values used in the study. When you plot the shadow study you can set other levels of shadowing as described below under Shadow Ratio Levels.
Mobile Facility Height
The Mobile Facility section of the Area Coverage Setup form is used to select the remote or mobile unit specifications for the shadowing study.
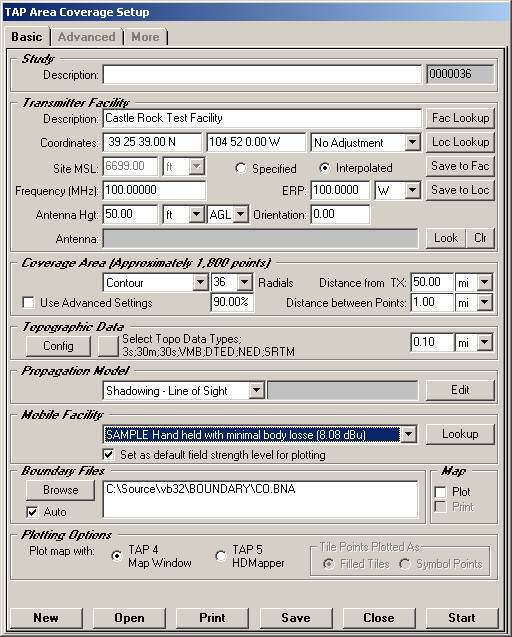
The Mobile Facility database (opened with the Lookup button) usually contains information about the antenna height of the mobile unit, as well as the antenna gain, receiver specifications, loss values, and other parameters needed to compute the required field strength for that particular mobile configuration. For shadowing studies, only the antenna height is considered. The other specifications are only needed if you later want to use the same Mobile Facility information for a field strength study using one of the propagation models.
Note in the Mobile Facility database that you can specify the antenna height above ground level (AGL) or above Mean Sea Level (MSL). This enables the shadow study module to be used for ground to air studies as well as for land mobile or other ground to ground systems. Normally, ground based mobile or remote units are described by specifying the antenna height above ground (such as six feet, 1.5 meters, etc.). Ground to air studies can be set up by setting the mobile receiver antenna height at the aircraft flight level above mean sea level (such as 30,000 feet, etc.). Be sure you select the appropriate units and reference for the mobile facility in your shadow study.
Shadow Ratio Levels
One of the most powerful features in the TAP Shadow Study module is the ability to define and plot any desired level of shadowing. The details about setting the levels are described in the article on Shadow Ratio Levels.
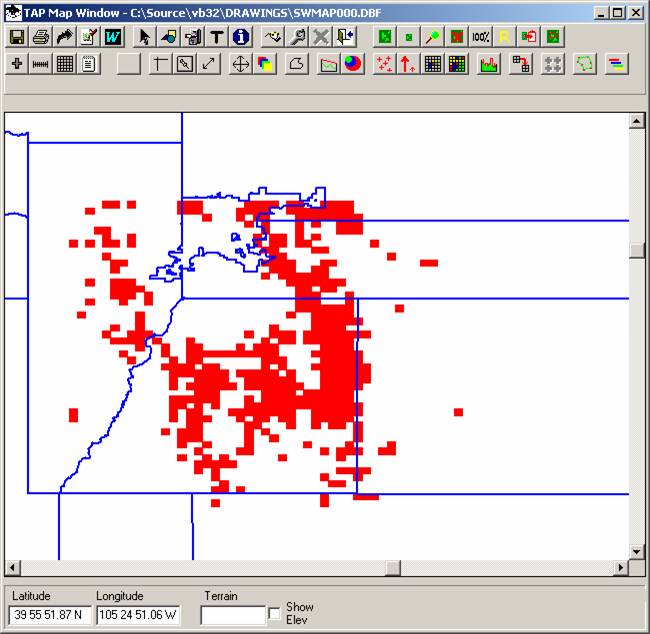
As an example, the following coverage map shows the areas where the base station provides line of sight in the surrounding area, as indicated by the red markers:
Using different Shadow Ratio settings for clear Fresnel (a level of 0.5) and minimal obstructions (a level of -0.1), you can see areas where half the Fresnel zone is clear at the green markers, and new areas with minimal obstruction (but no clear line of sight) at the light blue markers:
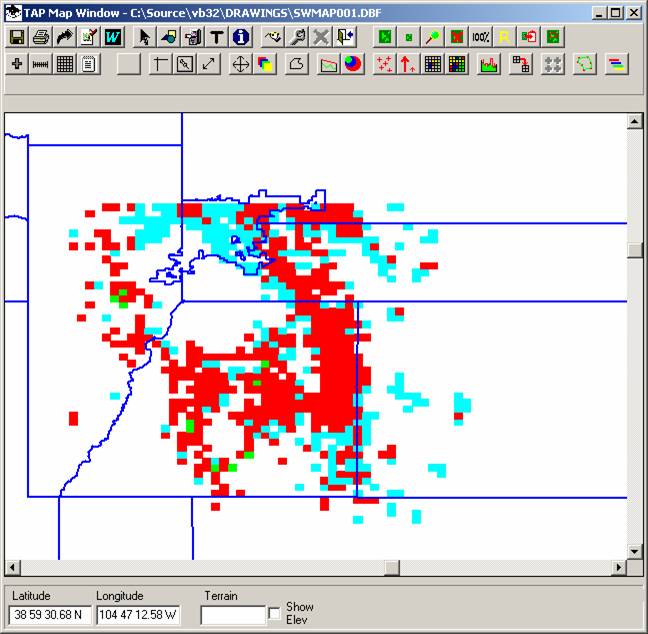
This kind of analysis can be useful to note that, in this example, most of the red areas showing line of sight do not have a clear Fresnel zone, meaning that there will be some signal loss. Further study may be necessary, such as a propagation study to determine the actual amount of signal available and if it meets the required level for the target remote or mobile facilities.
This analysis could also be useful for noting the light blue areas where the obstructions just barely block the line of sight and perhaps a taller remote antenna would provide a greatly improved received signal level at those locations.
Copyright 2004 by SoftWright LLC