Level dBm Increments in HDMapper™
Q: How can I show received power levels every 10dBm on a coverage map?
A: With TAP6.0.2236 or later and a Maintenance Subscription date of April 30, 2008, or later, you can create field strength levels that correspond to dBm received power levels in 10dB increments (or other increments you specify).
Note that all values in this example are for demonstration purposes only. You should determine appropriate settings for your application.
Computing coverage for a large target area in field strength instead of receiver input power gives you great flexibility and efficiency. But you can also use those computed results to display input power (in dBm) or input voltage (in dBuV) as described below.
Think of an area coverage study as a large number of point-to-point studies, from the base station to tens or hundreds of thousands of locations for a mobile unit. Ultimately we need to know the input power to the mobile receiver in order to determine the success or failure of communicating to that location. (This discussion looks at the base-to-mobile communication circuit, or the “talk-out,” but the same principles apply to the mobile-to-base circuit, “talk-back” or “talk-in.”)
That receiver input power is based on all of the factors in that communication link:
The transmitter power output (TPO) and all the gains and losses at the base station transmitter
The loss along the path to the particular location (free space loss and obstacles on the path)
The gains and losses for the particular mobile unit, including the hardware (a handheld or vehicle radio, a pager in the users pocket), and the immediate environment at the location (building and body losses, rf noise, etc.)
Computing the mobile receiver input power by considering all these factors will provide the information we need for that particular receiver hardware and local environment. Then we can compute another study to see the results using a different mobile configuration (such as a higher gain antenna on the handheld, changing the predicted building losses in the area, etc.). Then a third study can consider other changes to the mobile arrangement.
But TAP™ uses a better approach.
If the base station parameters (antenna pattern, effective radiated power, etc.) remain the same, then at each location in our area coverage study, the field strength, or the amount of energy available at each location, remains constant (expecting that the terrain and buildings also stay the same – usually a reasonable assumption).
Then the only variable is the different types of mobile hardware we expect to use for that service area, and the "required field" level necessary for that configuration. That means that we should be able to compute the field strength for the area once (very efficient) and then determine if that field strength is adequate for each of the possible mobile configurations (very flexible).
And that is what TAP does, by first computing the field strength (in dBuV/m, abbreviated "dBu") at each of the thousands of locations. For each location, the program determines the receiver input power level (in dBm) available to any combination of hardware and environmental losses is computed from that field strength value. The results on a coverage map can show the predicted service for several scenarios of mobile hardware and environmental conditions, all from running a single coverage study.
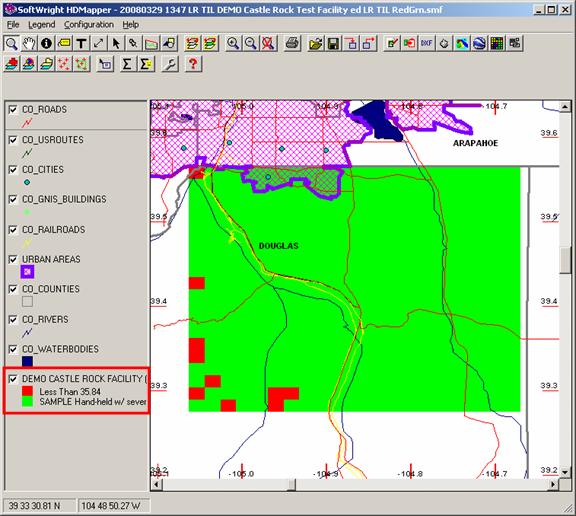
For example, suppose you have a coverage map computed with HDCoverage displayed in HDMapper. The sample shows the default settings with locations meeting or exceeding the Required Field level shown in green, and those below that level shown in red:
Right-click the coverage layer in the legend to display the options menu for that layer, and click the “Show dBm increment levels” item:

The power input levels in dBm will be shown using the current configuration settings:

The dBm levels to display and the corresponding colors can be changed as described below.
(With TAP6.0.2244 or later and a Maintenance Subscription date of July 31, 2008, or later, you can toggle between the dBm plot and back to the dBu plot.)
You can double-click the layer legend entry to display the Layer form where you can change individual color settings, etc.

Note that the field strength levels in dBu have been computed to correspond to the desired dBm power levels. The conversion between dBu and dBm (and other units) is described in the Field Intensity Units article.
The computed field strength levels (in dBu) used to plot the map are based on the desired input power levels (in dBm), and are computed using the specific parameters for this study (frequency, receiver losses, body and building losses, and other values in the Mobile Facility record used when the study was set up in HDCoverage). The dBu values for the same dBm power levels will not be the same for different mobile facility configurations and should not be used with other studies using different mobile facility parameters.
You can set the colors used to represent the different signal levels as a gradient display using the Set Range Colors function in the Tools menu on the Layer form:

The Range Colors form will be displayed. You can change the High or Low color value by double-clicking the High or Low label. The gradient of colors for the range will be computed.

When you have the color gradient you want, click the Continue button.
The new colors will be assigned to each level for the layer.

Click the Continue button to close the form.
The new color gradient settings will be applied to the map.

You can change the default dBm levels to use in this function. In the HDMapper Configuration menu, click the “Set dBm Increments” item:

A form will be displayed:

Enter the range and step value you want to use to display dBm levels, then click the Continue button.
A form will be displayed with the color settings to be used for each level. Click each color box to select the color and fill value to use for that level. Then click the Continue button.

The new settings will be used the next time you use the function to set the dBm levels.
|
|
Copyright 2008 by SoftWright LLC