TAP Composite Coverage Population Count
Q: Can I use my TAP Composite coverage study to do a population count in the coverage area?
A: For TAP 5.0.1030 systems with a Maintenance Subscription date of November 30, 2004, or later, TAP Coverage studies can be used to perform population counts in SoftWright’s HDMapper program.
Note that all values shown in this article are for illustration purposes only. It is important that you use good engineering judgment to determine the values that are appropriate for your equipment and specific application.
(Population counts are one common use of the more general Data Summation function available in HDMapper. Population counts are provided as a separate function as described in this FAQ.)
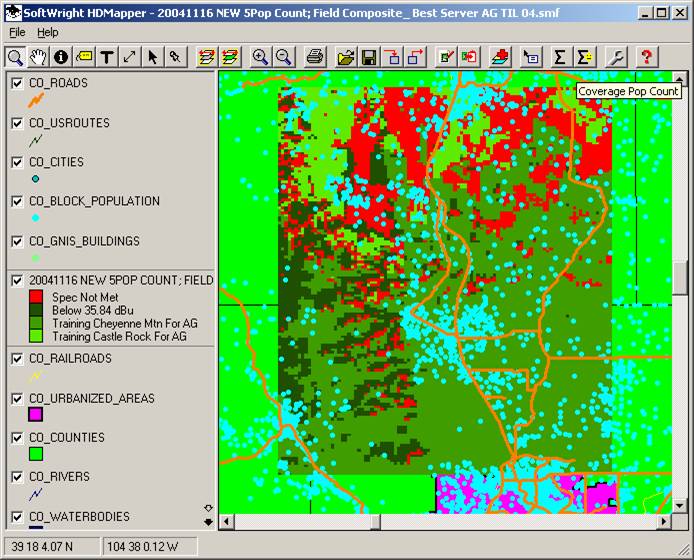
You must first setup and run the Area Coverage studies, combine them in a Composite study, and plot the coverage area with HDMapper. The Composite study must be run with the tile points plotted as “Filled Tiles”. Studies written as “Symbol Points” cannot be used for population counts.
The shapefiles created by Composite studies run with earlier versions of TAP (before TAP 5.0.1030) cannot be used with the population count function. You do not need to run the study again, but you can use the TAP “Export Coverage to Shapefile” function to create a new shapefile with the new version of the software. This new shapefile can be used for the population count. (Be sure to select “Write rectangles” in the Export function for the type of file to write.)
Likewise, if you want to use a Composite study that was created with a “Symbol Points” shapefile, you can use the Export function to create a new shapefile with “Filled Tiles” for the same study without running the study again.
You should be sure the population layer(s) you want to use are included in the map. The population layers can be included automatically with the “Set TAP5 Default Layers” function, or you can add layers to the map manually.
This FAQ describes Coverage Population Counts for Composite coverage studies. For population counts using Tile Coverage areas, see the article on TAP Tile Coverage Population Counts. For population counts using Contour coverage areas, see the article on TAP Contour Coverage Population Counts.
Population Count Setup
When the map includes the Composite coverage and population layers you want to use, click the “Coverage Pop Count” button:
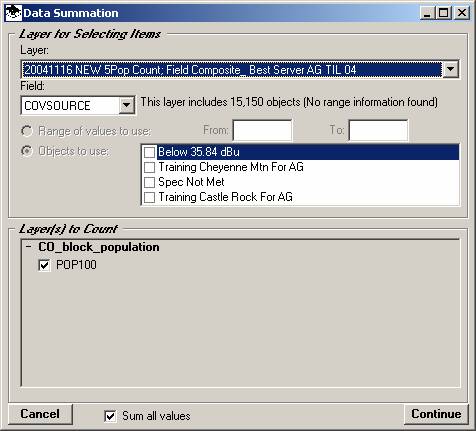
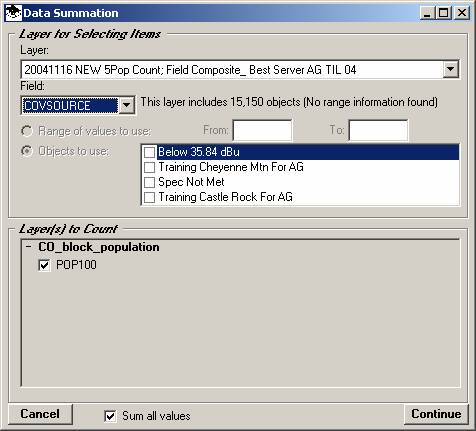
The Data Summation form will be displayed:
Layer to Use
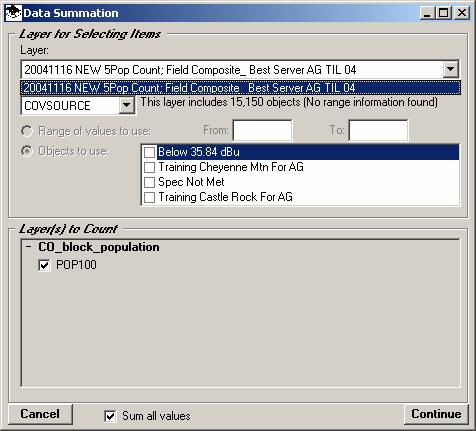
First, use the pulldown “Layer” list to choose the layer you want to use as the area to count. In this example, the map contains only a single Composite coverage layer:
(Note in the more general Data Summation function you can select any polygon area layer.)
Data Field to Use
Next, select the data value field to use. For Composite coverage studies, the only field available for coverage population counts is the “COVSOURCE” indicating the coverage source for each tile location:
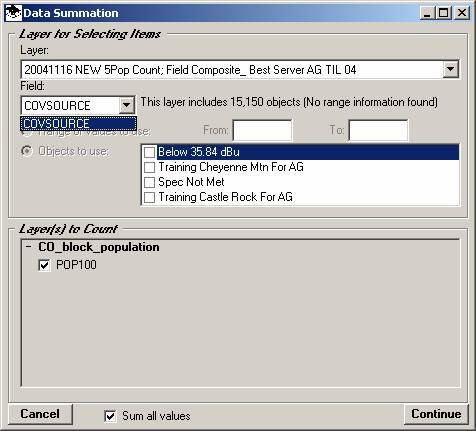
Composite coverage studies typically have four or more unique values in the COVSOURCE field:
□ Below xx.xx dBu This category indicates that none of the individual coverage areas provided the minimum field strength that was specified when the Composite Study shapefile was created. Therefore, no service is expected at these locations.
□ Spec not met This category indicates that the specification for the Composite function (such as a Capture Margin requirement) was not met. Therefore, no service is expected at these locations.
□ The remaining categories list the Task Description for the individual studies used to create the Composite study. Each of these categories indicates the source of service to be expected at each location
(Note in the more general Data Summation function you can select any data field in the layer.)
Data Field Values
Composite coverage layers contain unique values for each location as described above. Therefore there are no range values to select, and the ‘From’ and ‘To’ values are not used.
Select the values to include in the counting area.
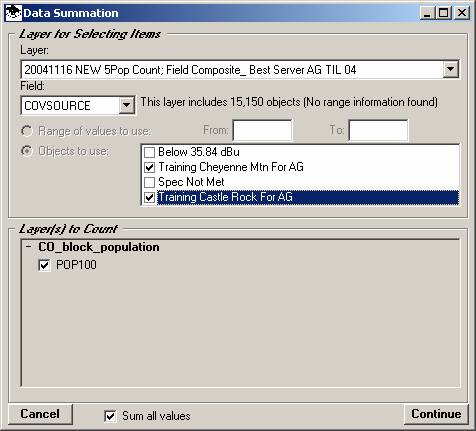
For a Composite study (as in this example), the values determine the tile areas to be used for the population count. When you select the values, only the population points that are included in tile areas having one of those values are counted.
For example, in a Composite coverage study you could select all of the Coverage Sources as shown above. This population count would give you the total population in the service area defined by these studies. As an alternative you could select only the “Spec not met” category to get the population count for the area where the two (or more) signals may be of adequate field strength, but would interfere with each other due to Capture Margin considerations. Selecting only the “Below xx.xx dBu” category would show the population in unserved areas due to low signal strength from both facilities.
This feature gives you great flexibility in selecting the value(s) in the Composite study to use for the population count.
(Remember that these values are for illustration only.)
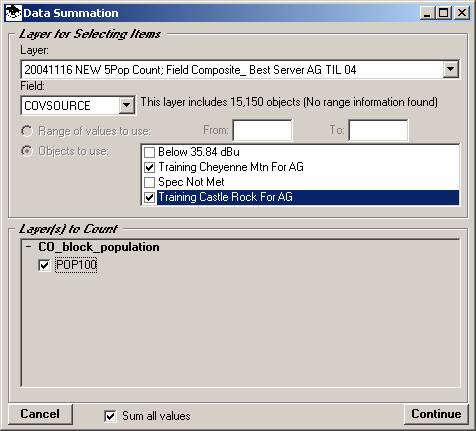
Layers to Count
Determine the layer(s) you want to count. For Coverage Population counts, the layers listed only included those layers that are recognized as containing population information, such as the U.S. Census Block Centroid layers.
(Note in the more general Data Summation function all “point” type layers are displayed and you can select data fields in any of the layers.)
Fields to Count
Select the data field(s) you want to count in each layer by marking the checkbox for that data field. For Coverage Population counts, the fields listed only include those fields that are recognized as containing population information, such as the “POP100” field in the Block Centroid files.
(Note in the more general Data Summation function all fields in the “point” type layers are displayed and you can select any data fields in any of the layers.)
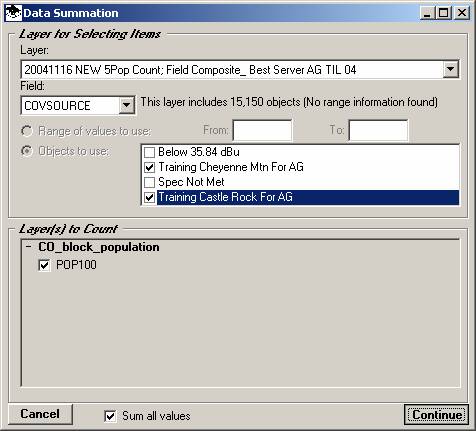
Sum All Values
If more than one data field is to be counted you have the option to sum all the fields by marking the “Sum all values” checkbox.
For population counts, only population fields are available for counting, so summing all the values is a useful function
In the more general Data Summation function, a variety of fields are available and may be selected and you may choose not to sum the “apples and oranges” totals for each field.
Population Count
When the information on the Data Summation form is set up as desired, click the Continue button.
The program will begin the population count, and an information form will be displayed:
When the count is completed, the results will be displayed in Notepad:
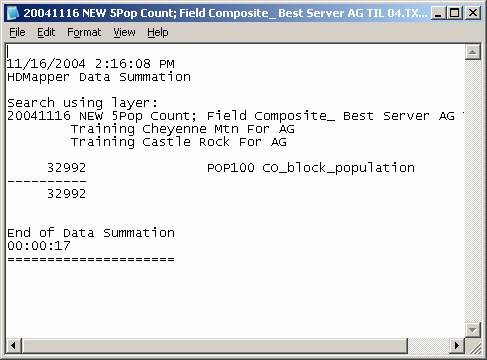
The information includes he name of the selection layer, the range information, and the population count for each population layer.
The information is written to an ASCII file in the same folder as the selection layer. The file is written in a sub folder named “DATA SUMMATION”:
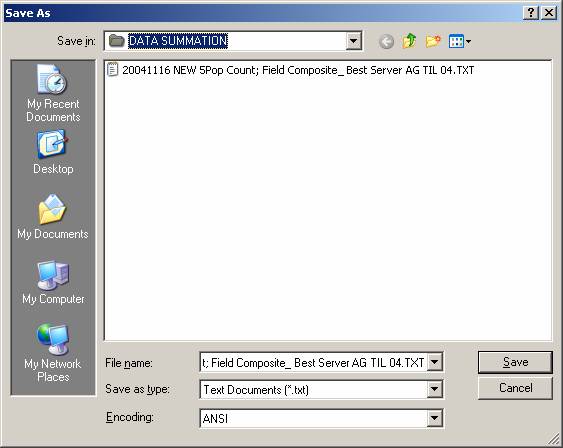
The file has the same name as the shapefile for the selection layer, with the TXT file extent.
You can save the file to a different name, or copy and paste the information into other documents, such as Microsoft Word.
If multiple coverage population counts are done using the same selection layer shapefile, the information will be appended to this file.
|
|
Copyright 2004 by SoftWright LLC