AutoCoverage Sample Files
Q: How can I run a sample study using AutoCoverage?
A: The installation of TAP 5.0.1025 and later includes sample files for running AutoCoverage.
The AutoCoverage module enables you to use an Excel worksheet (.XLS) or ASCII comma-delimited file (.CSV) to define, run, and plot coverage studies. The file format consists of a simple row-column layout with fields (columns) defined by the AutoCoverage program.
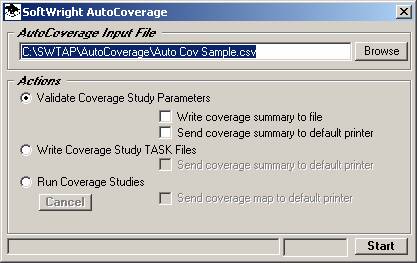
When the AutoCoverage form is displayed, use the Browse button to find the file “Auto Cov Sample.csv” in the “AutoCoverage” folder. This folder will be located under the folder where TAP is installed, such as SWTAP:
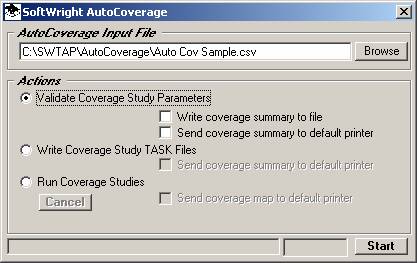
Select the “Validate Coverage Study Parameters” option and un-check the two check-boxes as shown. (You should consult the AutoCoverage Operation article for more detailed information on the various options available):
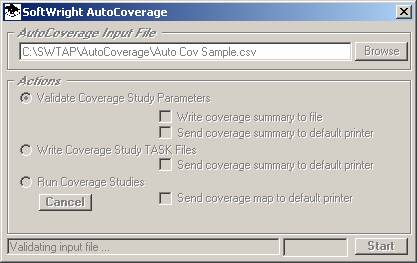
Click the Start button. The program will take a few seconds to validate the settings in the file. The form will be disabled during this process:
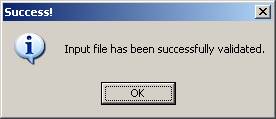
When the validation process is completed, a confirmation message will be displayed:
(If the confirmation form is not displayed, or any input file errors are reported, please email the error report file to support@softwright.com, since there may be other configuration settings on your machine that need to be set to run AutoCoverage.)
Click the OK button to close the confirmation form.
If you want to see the information in the input file, open the file with Excel (you will need to close the AutoCoverage form first to avoid a sharing violation):
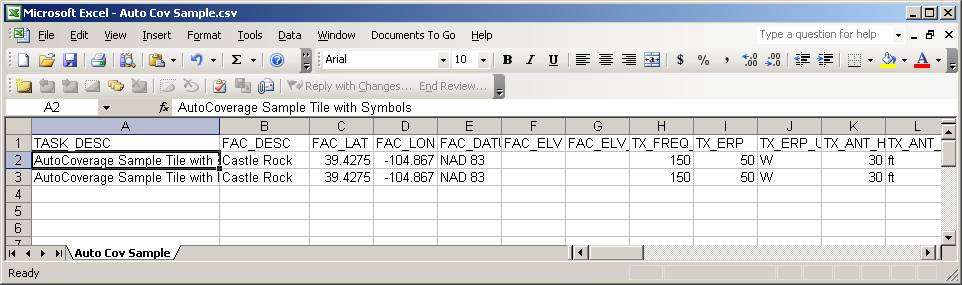
The parameters for the studies can be edited, or new rows added for additional studies using the normal Excel functions. Note that no error checking is done until you run the Validate function in AutoCoverage.
To run the sample studies, start AutoCoverage again, and select the “Run Coverage Studies” option as shown. If you want to send the sample studies to the default printer, check the box as shown. (You should compute and plot a study using HDMapper to be sure all the defaults, such as the map size, default shapefiles, etc., are set the way you want them for the printing from AutoCoverage.)
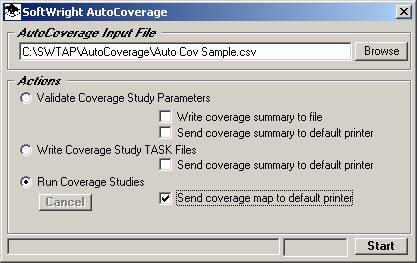
The two studies will take several minutes to run, and you should see several progress indicators, as well as the maps briefly displayed on the screen.
Also, as the Task files are written (before the actual study execution begins) a log file will be displayed showing the Task ID values assigned to each of the studies:
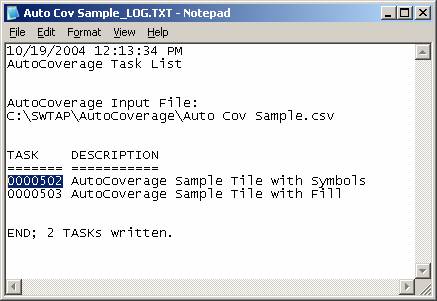
The Task ID values are important later for finding these studies in other TAP functions.
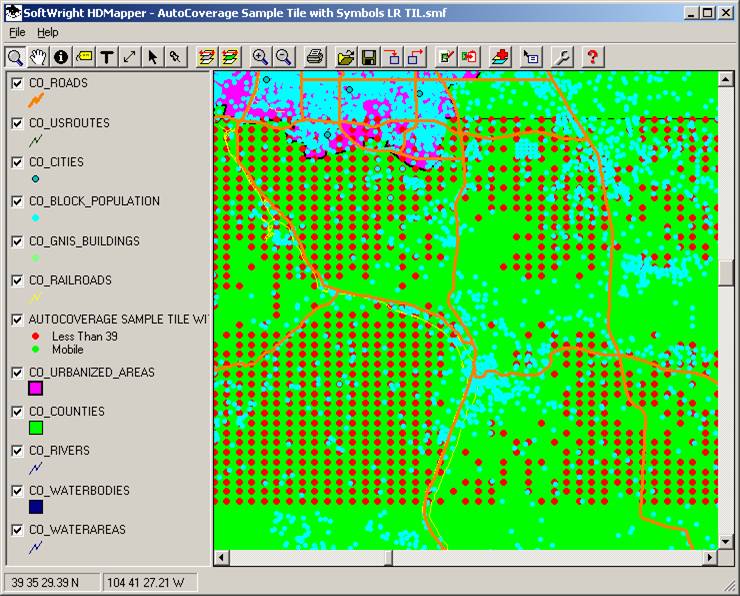
The results should be two tile studies, one drawn with filled rectangles for each tile location:
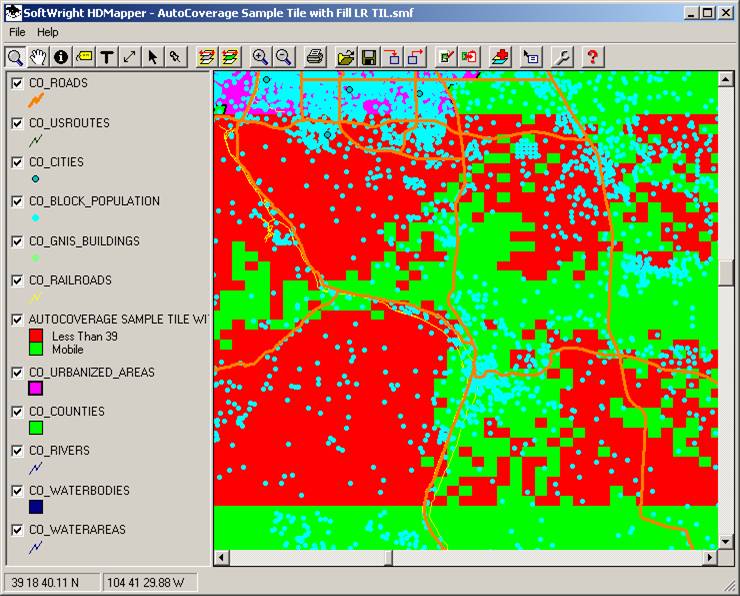
The second map is the same study drawn using point symbols at each tile location:
If you want to see the operation of AutoCoverage when the input file contains errors, open AutoCoverage again and select the input as the “Auto Cov Sample with Error.csv” file:
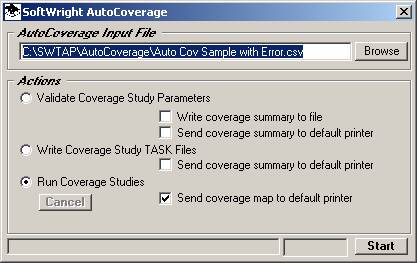
With the “Run Coverage Studies” option selected, click the Start button.
The error log for this input file will be displayed:
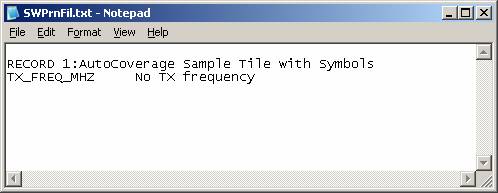
Note that the log shows an error in Record number 1, and specifies that the TX_FREQ_MHZ column does not contain a valid frequency value.
Open the “Auto Cov Sample with Error.csv” file:
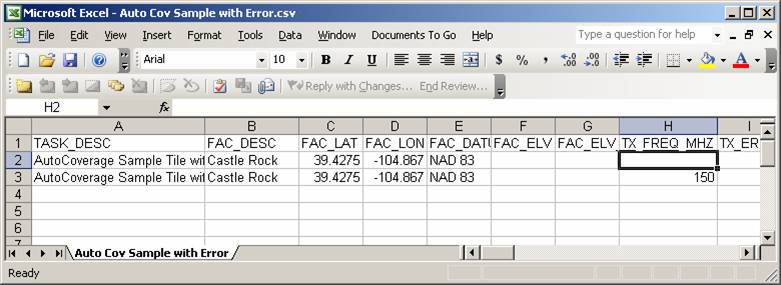
Note that the TX_FREQ_MHZ column is blank. If you enter a valid frequency (a numeric value greater than zero) you would be able to use this input file to run the studies with AutoCoverage.
Note also that even though the “Run Coverage Studies” option was selected, the program stopped after the validation process was unsuccessful. The information is only written to the Task files, and the studies only run, when all information in the file has been validated.
|
|
Copyright 2004 by SoftWright LLC