Q: How do I draw an elevation contour map or surface map with TAP?
A: TAP enables you to specify a rectangular area, then write the topographic elevation information to a grid file (.GRD) that can be read directly by the TAP 3DDisplay module, or by SURFER™ from Golden Software..
From the TAP menu, click Topography, then select "Area Grid":
The Topographic Area Elevation Data form is displayed:
Set the information on this form for the area of topographic data you want to use:
Task ID: This is an internal ID assigned by the program
Description: Enter a description of what you are doing, such as the area to be extracted. This description will be used later when you want to work with the results of this study.
Search Data: Check the boxes for the data resolution you want to use. 30-meter data is the highest resolution, and 30-second is the lowest resolution. You should only check the types of data that you have available for the area. For example, if you have no 30-meter data for the area under study but you check the "30-meter" box, the program will search for 30-meter data. When the program cannot find the 30-meter data, it will next look for 3-second data, etc. Looking for the data will increase the time for the program to run. If in doubt, you can check all the data types, but if you know the data is not available, you can improve the performance of the program by not checking the missing data type(s).
Interpolation: Select the interpolation method to use when reading the elevations from the topographic data files.
Config: You can use this button to change the topographic data configuration that tells the program where to look (CD-ROM, hard-disk, network disk, etc.) for the topographic data files.
Latitude, Longitude: Enter the north, south, east, and west limits of the area you want to plot. Note that as you change these values the values to the right (central latitude and longitude, and ranges) also change. You can also use the Template button as described below to define the coordinate limits.
Central Latitude, Longitude and Ranges: You can also enter a central location (such as a transmitter site) and a range in the north-south direction and in the east-west direction. The area limits to the left will be computed.
Facility, Location: These buttons enable you to use the lookup functions to either the Fixed Facility data base or the Location data base in order to read coordinate values from those data base files and put the coordinates into the central latitude and longitude fields.
NS Grid Step, EW Grid Step: Enter the increment in each direction for the grid file to be created. The size of the grid is displayed below the step values.
Template: The Area Template data base enables you to enter and save area definitions that you may want to use frequently. For example, if the area is an important target area for coverage studies, such as a business district, or highway interchange area, you can define the area in a template, then use the template for a variety of different studies in TAP, such as this topographic grid, tile coverage studies, etc.
To use the Area Template, click the Template button. The Area Template form is displayed.
You can find and select an existing template and click the "Close" button to use that template information. You can also edit an existing template (with the "Edit" button), or create a new template (with the "New" button). Enter the limits (or central coordinates and ranges) and the grid (or "Tile" steps) as described above. Click Save after making any changes, then click Close to use the template information.
Format: To use the file with the TAP 3DDisplay module or with SURFER, select the SURFER format. You can also save the values as an X-Y-Z file with longitude, latitude, and elevation values. This format may be useful for other applications that do not use the SURFER grid format.
X-Y Unit: Select the units to use for the output file. If you want to use the topographic information in SURFER with other files that are based on latitude and longitude values (such as .BNA boundary files, or TAP coverage information) you should select Lat-Lon for the units.
Z-Unit: Select the units for the elevation values to be written to the output file.
Filler Z: Enter the value to use if the elevation for a point is not found. If you want to write a SURFER "blanking value" to the grid file, enter –9999. If you want to use a specific value, enter that value. For example, if the area is on a coastline and you believe some of the data over the ocean is not available, you can enter a value of zero to put into the grid for the missing data.
Reference Location: This information is only used if you select certain X-Y Unit configurations for compatibility with older versions of TAP.
File to Write: Enter the name of the output file you want to write. For 3DDisplay and SURFER grid files, the default file extent should be .GRD. You can use the Browse button to find a folder where you want to save the file.
Execute Now, Execute Later: Select the option you want. If you select "Execute Now" the program will start as soon as you click the "Continue" button. If you select "Execute Later" the study information will be saved and you can execute the task through the Files menu under Tasks. This enables you to set up multiple studies, then execute them together, such as overnight.
When you execute the study, a progress form will be displayed:
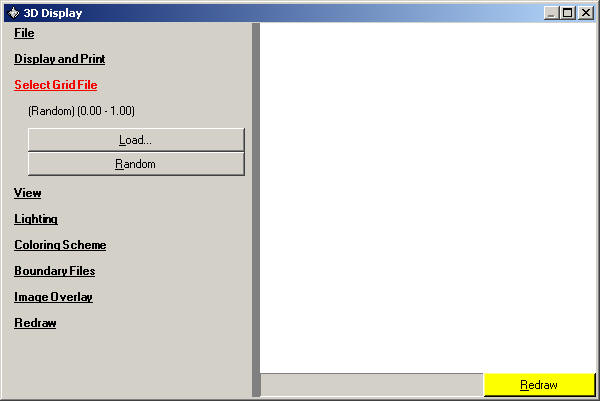
When the program is finished, launch the 3D Display module from the File menu in TAP.
When the 3D Display form is displayed, use the Select Grid File option to open the GRD file you just created:
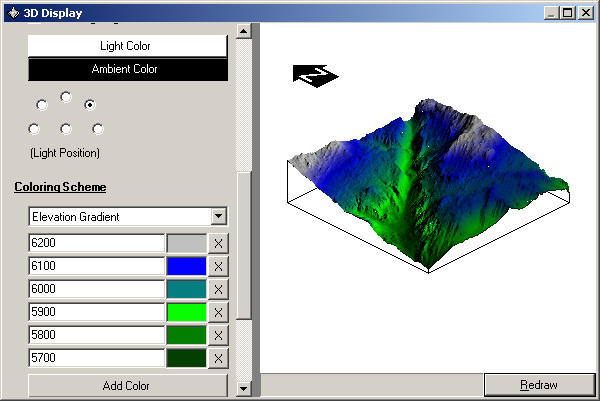
You can use the lighting, coloring, and other settings in 3D Display to customize the image:
When the program is finished, exit from TAP and execute SURFER. In the SURFER menu, select Map. Then click on either "Contour" or "Surface", depending on the type of drawing you want.
When the Open Grid dialog box appears, select the grid file you just created. SURFER provides numerous options for customizing the plots. You can accept the default values to get a preliminary view, then use these options to make the changes you want.
To add boundary information to the plot (such as borders or roads from .BNA files), use the Map menu and select "Load Base Map". To align drawings (such as the topography and boundary information, select all of the drawing objects, then in the Map menu, select "Overlay Maps".
Copyright 2000 by SoftWright LLC