Coverage Studies with HDMapper™
Q: How do I run a TAP coverage study so the results can be plotted with HDMapper?
A: HDMapper is available to TAP 5 users with TAP version 4.5.982 or higher with a Maintenance Subscription date of May 31, 2004, or later. The Area Coverage Setup form in TAP 5 includes a new section for setting up HDMapper.
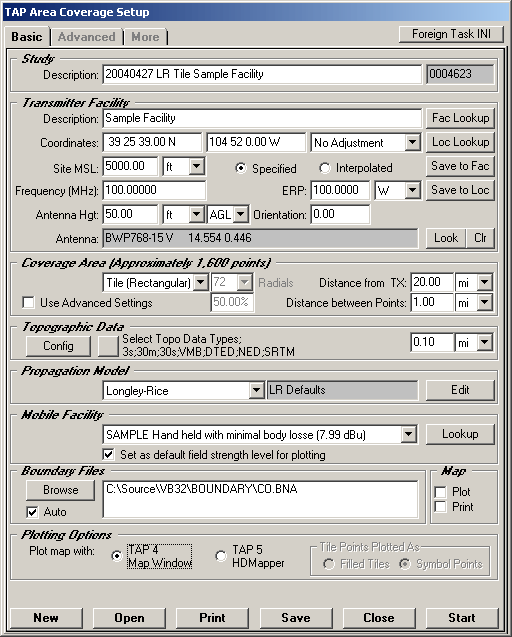
The Plotting Options section is near the bottom of the Area Coverage Setup form:

If you want to plot the coverage study using the TAP 4 Map Window, select that option.
If you want to plot the coverage study using the TAP 5 HDMapper, select that option as shown below:
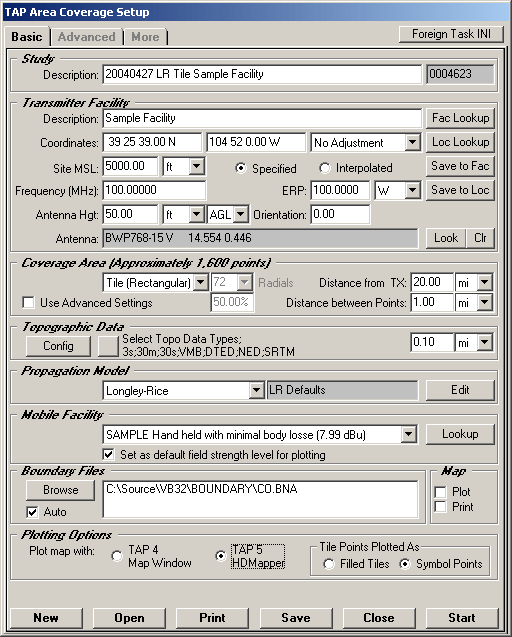
Note that if you are computing a Tile study, the "Tile Points Plotted As" section is enabled. With HDMapper, you can plot results of a Tile study in two different ways:
(This article covers only the coverage setup portion of using HDMapper. For more information about creating and modifying HDMapper maps, see the HDMapper Overview.)
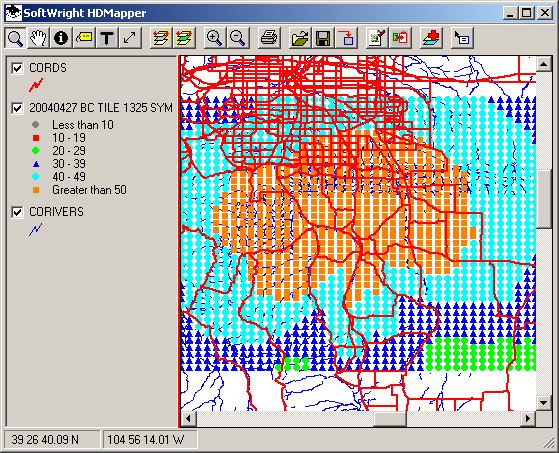
For example, the following coverage map was prepared using Symbol Points (as shown on the legend on the left side of the map):
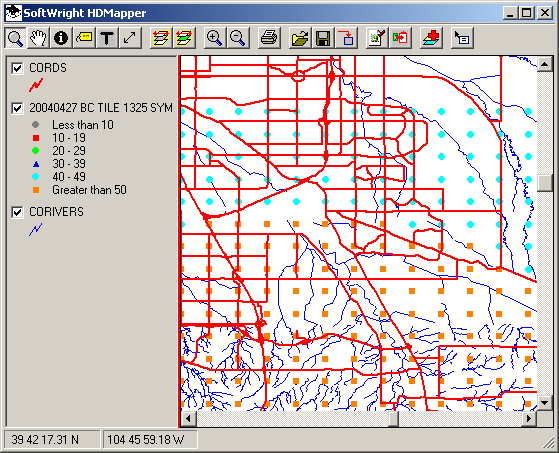
The same map shows the individual point locations when you zoom in to see more detail:
The same coverage area prepared with Filled Tiles is shown below:
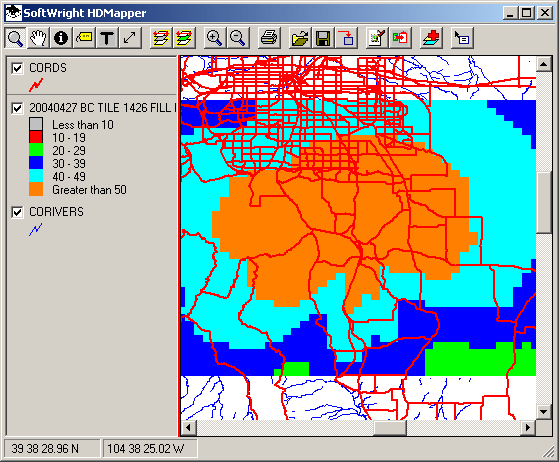
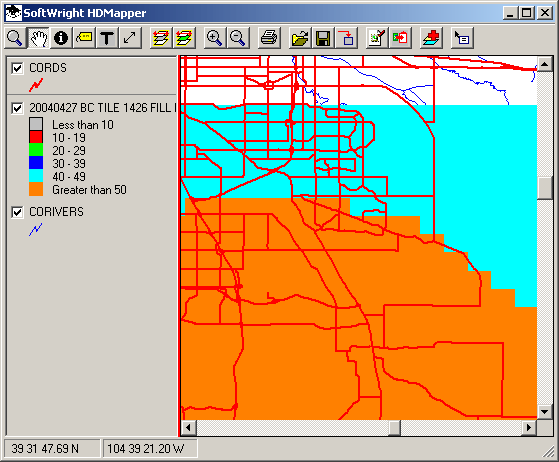
When the Filled Tile map is zoomed, the tiles remain contiguous:
Copyright 2004 by SoftWright LLC