Bullington Obstacle Peak Function
Q: How does the “Obstacle Peak” function work for selecting terrain obstructions in the Bullington model?
A: The Obstacle Peak function is one of several methods available for configuring the Bullington model.
In any program that attempts to automate the calculation of path loss (in contrast to step by step user-intervention in the process) a critical step is the selection of path obstacles to consider. Since the topographic data for a path is most likely available in the form of an array of individual elevation values and a corresponding array of distance values, the program must process the arrays and determine which values represent peak obstructions, a task that the human engineer does more or less intuitively by looking at a profile plot of the path.
The Obstacle Peaks function first determines the vertical range of elevations along the path. Then, beginning with the highest elevation on the path, the program creates hypothetical "contours" in five-foot increments for the entire length of the path. (The default value of five feet can be adjusted using the "Peak Resolution" value in the program.) That is, the first contour represents a band along the path between the maximum elevation and five feet lower, the next contour is from five feet down to ten feet, etc. (This method was originally developed for use with the TAP Rounded Obstacle model.)
The program analyzes every point on the path to determine if it is within one of these bands. A "peak" is defined whenever a series of consecutive points along the path enter the bottom of a particular band and leave through the bottom of that band without penetrating the top of the band. In the simplified illustration below, the dashed lines represent the hypothetical contour bands for the profile. In each case, the "peak" is represented at the center of the range of the penetration of the contour band.
After the peaks along the path are determined, further analysis on the path elevation peak values is performed to determine the knife-edge diffraction loss for the Bullington model.
The Obstacle Peak Loss Method can be selected on the Bullington Template for a propagation study:
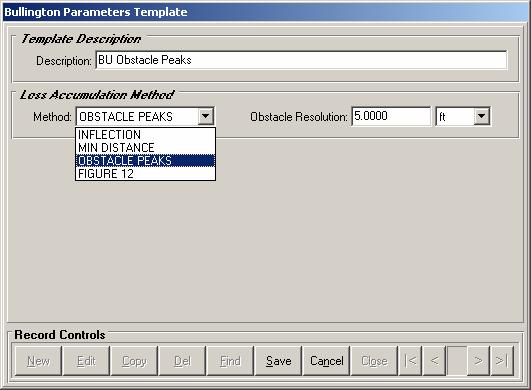
The height distance between the bands described above (used to identify peaks) is set with the Obstacle Resolution value on the template.
|
|
Copyright 2005 by SoftWright LLC