
Plotting Antenna Patterns as dB Down from Major Lobe
Q: How can I plot an antenna showing the pattern in dB down from the major lobe?
A: With TAP6.0.2252 or later and a Maintenance Subscription date of August 31, 2008, or later, you can show the pattern as dB down from the major lobe.
Note that all values in this example are for demonstration purposes only. You should determine appropriate settings for your application.
Sometimes it is helpful, when comparing different antenna patterns, with different major lobe gain values, to view the pattern as dB down from the major lobe.
Please note that the changes made to the gain values described in this article only affect the graphical plot presentation of the antenna pattern, not the actual gain values or pattern information in the antenna library. Changes made to the library antenna patterns must be made using the TAP Antenna Editor.
For example, suppose you have an antenna plotted as shown below:
This is a 6dBd gain antenna, as shown by the major lobe.
Note you can also adjust the minimum scale value (the center of the polar plot).

Set the minimum value you want to use:

The plot will be redrawn:

Antenna patterns plotted in dB values can appear radically different depending on the scaling selected. If you are trying to compare an antenna to, for example, a plot in a manufacturer’s catalog illustration, be sure the scaling values are similar.
To view the pattern relative to the major lobe, select “Plot as dB down” in the Antenna Plot menu.
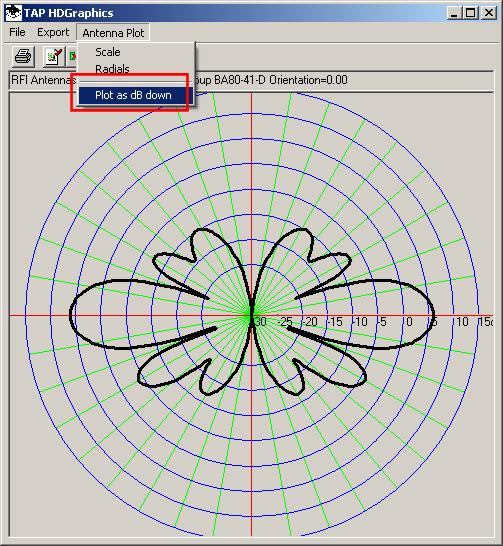
The pattern plot is redrawn, setting the major lobe at 0dB, enabling the gain values on other azimuths to be viewed on the graphic and read from the mouse tips in the number of dB below the major lobe.

To return to the plot of the actual antenna gain values, click the “Plot as dB down” menu to un-check it.

The pattern plot is returned to normal.

|
|
Copyright 2008 by SoftWright LLC