OBJECTIVE: To understand the basic operation of the TAP Intermodulation Study Report Generator program, including the various configuration options related to the scope of the intermod report. The TAP Intermod Study Tutorial is a prerequisite to this tutorial.
In this tutorial, you will use the intermodulation Report Generator to analyze the intermodulation products computed as a function of transmit and receive frequencies, transmitter harmonics, protected receiver frequencies and other study parameters defined in the Intermod Study Tutorial. When you executed the intermod tutorial, TAP calculated and compared resultant intermod products to receive frequencies for those transmit and receive facilities you opted to use.
The TAP intermod Report Generator allows you to apply one or more filter conditions on the intermod resultants generated in an intermod study in order to generate a report consisting of a subset of the original set of intermod products. In this manner, you may choose to run a comprehensive intermod study and then isolate and analyze the results in order to exclude intermod products you consider to be more remote.
Our TAP intermod tutorial generated just a small set of resultant products. When you use TAP to analyze a large number of transmit and receive frequencies, you will find the filter options quite useful to your analysis.
You are advised to consult the section on Finding, Solving, and Preventing Intermodulation Problems for more detailed technical information related to the diagnosis of existing intermod problems and the interpretation of the TAP intermod results.
The TAP Intermod Study tutorial generated an intermod products file using the intermod study parameters pictured below. Given these results, we will use the TAP intermod report program to assist our analysis of potential intermod problems.
From the main menu of TAP, use your left mouse button to click on the Intermod menu, then on the Report option.
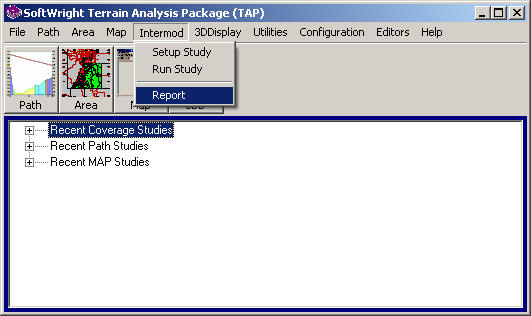
If you are using TAP5 or earlier, the menu will appear as shown below:
Your intermod Tasks List displayed on the Intermodulation Report Generator that first appears may differ from the one displayed below depending on the extent to which you have run the intermod study program in the past. If you have run only the TAP intermod tutorial, your screen should look like the one pictured below. If more than one study appears in this list, select the TAP Intermod Study Tutorial with your left mouse button.
We will use the Product Filter Options to the right of the task list to define the contents of several different reports. These filter options are applied to the study configuration defined in the intermod study setup program. You are able to further restrict reported results but not relax your original settings. For example, we excluded products that combined more than three transmit frequencies in the original tutorial study. We cannot at this point look at products with four components.
Use "Filter on Product Frequency" to view resultants within a desired range of product frequencies.
Use "Filter on Component Frequency" to view resultants with at least one of its component frequencies within a specified range of frequencies. We will use this option later to isolate and report only the resultants that combined a TX Test #3 (400.05 MHz) harmonic in the calculated products.
Use "Filter on Maximum Combinations" to direct TAP to report only those products that combine some number of transmit frequencies less than or equal to the specified maximum number of combinations. Our original maximum combinations was set to three – we could reduce this value to two or one in order to control the number of possible transmitters combined in our intermod products. We will demonstrate the use of this filter below.
Use "Filter on Order Range" to define an acceptable range of product orders. Our maximum order was set to 5 in the intermod setup program. We will isolate orders 1 to 3 in a filtered report below.
Use "Filter on Harmonics Range" to report products that combine harmonics that fall within a specified range. The maximum harmonic assigned to any of the transmitters when we set up the intermod study was 5. We could create a subset of the original intermod products by assigning a value less than 5 to the upper limit of the harmonics range specified with this filter.
You may recall that our intermod study database consisted of just two receive frequencies: 600 MHz and 1 GHz. When you use TAP to study many more frequencies, you may wish to view the intermod products within a certain range of frequencies. Select the Filter on Product Frequency option to make the Product Frequency Range Filter visible.
Let’s isolate the 1 GHz intermod hits from the 600 MHz products. Recall that we specified a receiver offset of 100 KHz for each receiver. It is theoretically possible that TAP generated intermod products between 999.9 MHz and 1000.1 MHz for the RX Test #1 facility. Position your cursor in the Freq Low column and enter 999.9 MHz.
Press the horizontal scroll bar of the frequency range in order to navigate to the upper limit of the frequency range. Enter 1000.1 MHz in the Freq High column as we have done.
Note the Output Options frame at the bottom of this screen. When we generate this report, we will essentially overwrite the text file T0000001.TXT we created when we first executed the tutorial intermod study. You have the option to press the Browse button and save the new report to another file. We will not need to do this here.
Press the Continue button to create this report.
Since the ASCII text file already exists (containing the original intemod study results, you will be prompted to choose to overwrite or append to this file, or to specify a new file name:
For this tutorial, click the Append button so we will preserve the original information in the file and add the new results at the end of the file.
Since we are appending to the file, when Notepad opens with the file, you will need to scroll down to the bottom of the file to see the new information.
A portion of the resulting report is pictured below. It turns out that 21 of the original 29 total intermod products involved potential interference problems with the RX Test #1 facility. Let’s analyze the 1 GHz products further.
When your review of this report is complete, Exit Notepad either through the File menu, enter Alt + F4 or press the X button in the upper right corner of Notepad.
Press the Yes in response to the Do more? dialog box in order to generate another report.
Initially, we set up our study to exclude intermod combinations with product orders in excess of 5. Typically, the lower order products are more likely to occur. Let’s fine tune our study further and concentrate on orders 1 to 3. Select the Filter on Order Range filter option and enter the order range 1 To Order 3. Note that when we execute this filter we apply BOTH the frequency and the order filters to the intermod results database. Wait – do not execute these filters just yet.
In the sort options list of the output options frame is the sort by Order option. Press the down arrow to the right of the Sort label to view your sort options and select Order. In this way we will direct TAP to exclude orders in excess of three AND sort the remaining products by order.
The Report Generator form should look like the one pictured below.
Click the Continue button to create the report.
Since the ASCII text file already exists (containing the original intemod study results, you will be prompted to choose to overwrite or append to this file, or to specify a new file name:
For this tutorial, click the Append button so we will preserve the original information in the file and add the new results at the end of the file.
Since we are appending to the file, when Notepad opens with the file, you will need to scroll down to the bottom of the file to see the new information.
The four intermod products that met our criteria are written to the text file with the lowest order (order = 2) at the top of the list.
Exit Notepad as we did before and press the Yes in response to the Do more? dialog box.
Let’s take a different approach to narrowing our study. First, we will remove the filters we previously applied. Deselect the Filter on Product Frequency and Filter on Order Range options, select "Resultant" for the Sort, and start fresh as we have done below.

Suppose we are contemplating the addition of TX Test #3 (400.05 MHz) on our tower and wish to view all intermod products in which a TX Test #3 harmonic is combined into an interfering product. We begin by selecting the Filter on Component Frequency option.

In the Component Frequency Range that appears, enter Freq Low equal to 300 MHz.
Next, enter a Freq High of 500 MHz. In our case, the range 300-500 MHz is sufficient to include only the TX Test #3 frequency.
Let’s configure our report to identify the terms that TX Test #3 contributes to the intermod products contained in this report. Select Description in the Identify Components by options list of the Output Options frame. This feature will provide additional textual descriptions of the transmitter descriptions contained in the intermod database.
The report setup form should look like ours below.
Click the Continue button to create the report.
Since the ASCII text file already exists (containing the original intemod study results, you will be prompted to choose to overwrite or append to this file, or to specify a new file name:
For this tutorial, click the Append button so we will preserve the original information in the file and add the new results at the end of the file.
Since we are appending to the file, when Notepad opens with the file, you will need to scroll down to the bottom of the file to see the new information.
Your filter criteria should have generated 8 products like ours did. As you can see, the TX Test #3 harmonic appears in each of the displayed intermod hits. Note that TX Test #3 potentially poses problems for both RX Test #1 and RX Test #2. Let’s narrow the scope even further and demonstrate the use of the maximum combinations filter.
Once again, Exit Notepad and press the Yes in response to the Do more? dialog box.
In the Report Generator, press the Filter on Maximum Combinations option. Note that it is presently set to three, the value we specified when we first set up this study.
Generally, intermod products of two components are of more practical importance than products of three components with comparable orders. Let’s reduce the number of possible transmitters that may be combined in any intermod product from three to two. Use your left mouse to pull down the list of Maximum Combinations and set it to 2.
Before generating this report, let’s direct TAP to sort the resultants by Order. Our report will be sorted by product order and identify the intermod products in which a TX Test #3 harmonic is one of two possible components. When your Report Generator looks like ours below, press the Continue button.
As you can see, we have narrowed our focus to six intermod products involving TX Test #3, two of which are 2nd order products.
Exit Notepad and press the Yes in response to the Do more? dialog box.
This concludes the Report Generator tutorial. Your studies are likely to be significantly larger. You may wish to use some of the techniques demonstrated here to reduce the scope of potential intermod problems and prioritize them in order of their practical importance. As mentioned previously, consult your TAP technical reference manual for more detailed information related to the study scope parameters and interpretation of the TAP intermod results. When you are through experimenting with the intermod report mechanism, press No to exit this program.
|
|