Field Strength Values with Mouse Tips in HDMapper™
Q: How can I see the actual field strength value at a particular location in HDMapper?
A: You can use the Mouse Tips function to display values at individual locations.
Note that all values in this example are for demonstration purposes only. You should determine appropriate settings for your application.
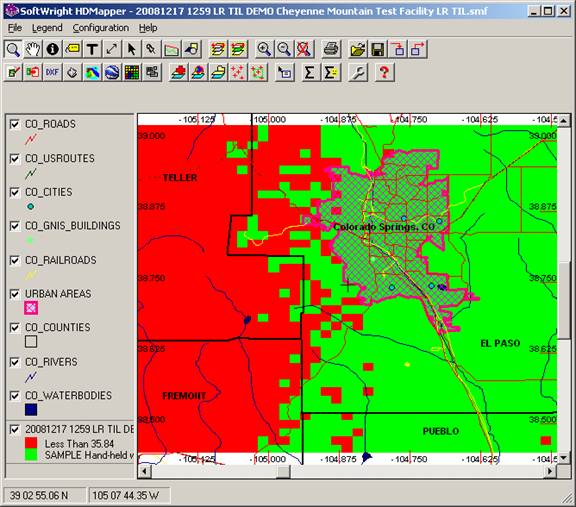
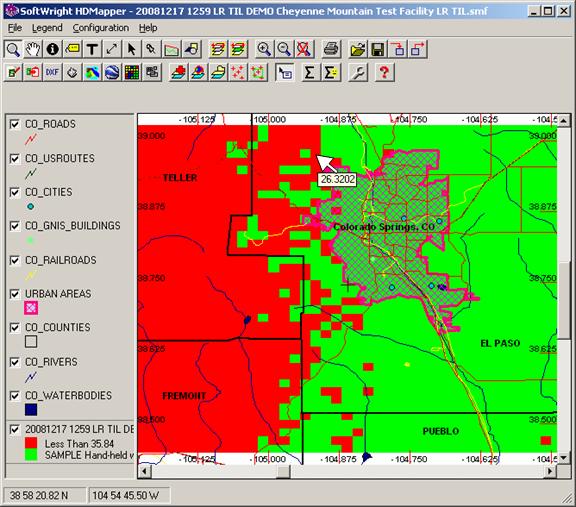
Suppose you have a coverage map displayed in HDMapper as shown:
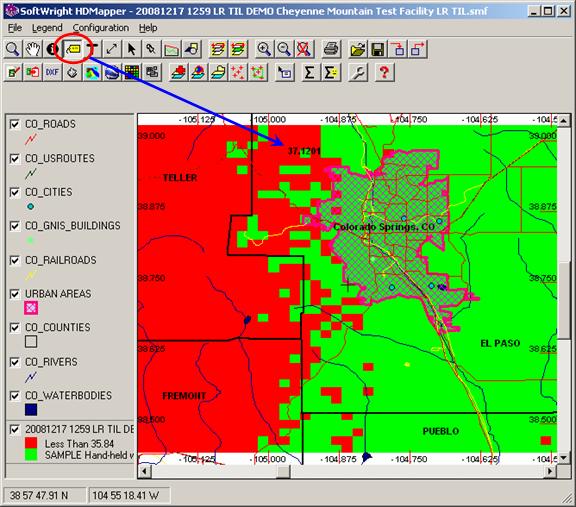
The Mouse Tips button enables you to select a field in the current layer to display as you move the mouse over the map.
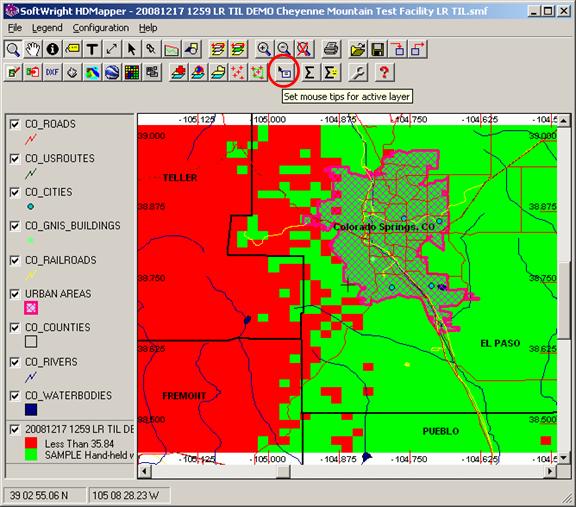
First, click the coverage layer to select it as the current layer.
Then click the Mouse Tips button:
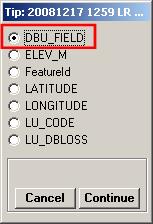
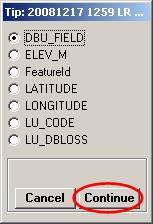
A form will be displayed so you can select the field you want to display in the Mouse Tips:
Shapefiles (including the coverage layer) can contain a variety of database values or “data fields” in addition to the graphical information. The content of the data values (from a few to dozens) depends on the purpose the shapefile was created to fulfill.
In addition to the field strength in dBu (“DBU_FIELD”) value, the shapefile for coverage studies in TAP also include other fields that can also be used with the Mouse Tips function if they would be useful to you:
ELEV_M is the elevation of the location in meters
FeatureID is an internal database ID that is not of particular use in this application
LATITUDE and LONGITUDE are the coordinates of the location
LU_CODE is the numerical USGS Land Use Classification value at each location (if the Land Use function was included in the original study)
LU_DBLOSS is the additional loss value, in dB, that was applied to the computed field strength at the location, based on the Land Use Classification, the operating frequency, and the Land Use Loss Template used in the study. (The DBU_FIELD value is the net received field that has already taken the LU_DBLOSS value into account).
With the desired data value selected, click the Continue button:
Now as you move the mouse around the map, the field strength value will be displayed at each location:

You can turn off the Mouse Tips function by clicking the coverage label again.
Similarly, you can use the Label function to select the DBU_FIELD value, click a location, and add a label of the field strength to the map:
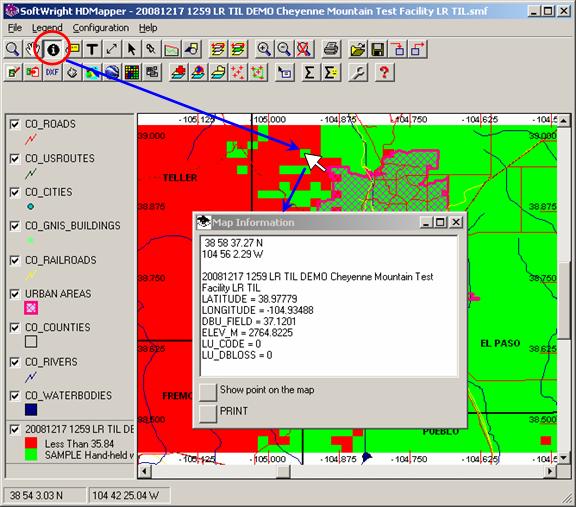
The Information button can be used to display all of the data values at the location:
|
|
Copyright 2008 by SoftWright LLC