Elevation Values in HDMapper™
Q: How can I show elevation values on my map in HDMapper?
A: If you have run a coverage study (in particular, a Tile study) you can use the results shapefile from the coverage study to show elevations.
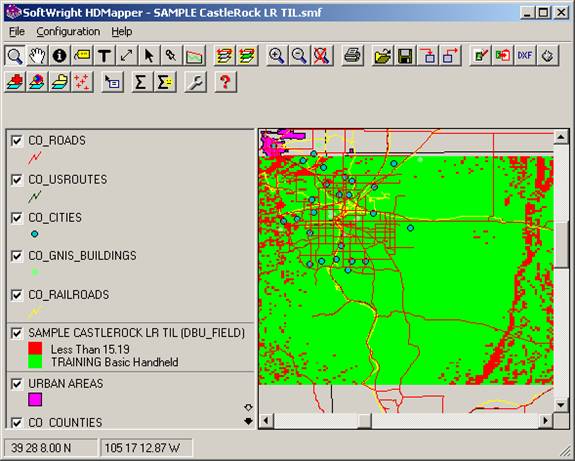
For example, suppose you have created a coverage study and plotted the coverage in HDMapper, as shown below.
By default, the coverage map displays the field strength levels of the study, shown by the red and green areas in the SAMPLE CastleRock LR TIL (DBU_FIELD) layer:
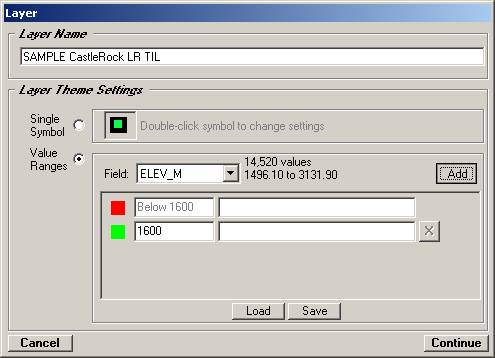
If you double-click the SAMPLE CastleRock LR TIL (DBU_FIELD) layer, the Layer Properties form is displayed:

This form shows the database field in the coverage shapefile that is being displayed (the “DBU_FIELD” data), as well as the colors and range “break points” and descriptions for the data being displayed.
Typically, shapefile databases contain several data categories, or “fields”. You can see the fields in the shapefile using the “Field” list in the Layer Properties form:
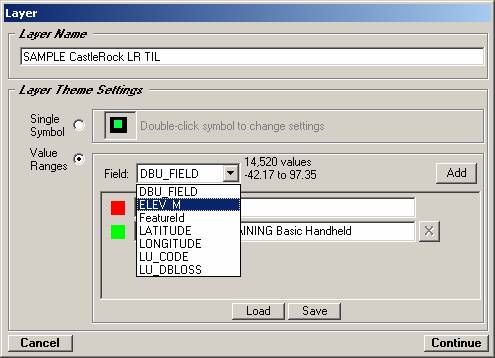
This list shows the data fields in the coverage shapefile created by TAP.
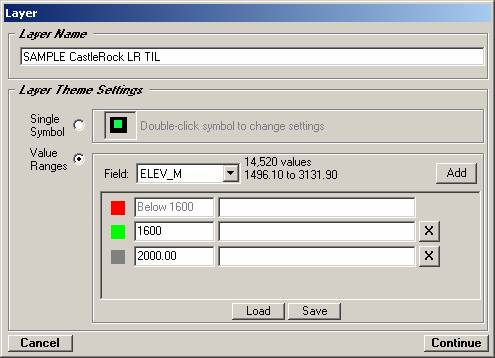
The ELEV_M field in a TAP coverage results shapefile contains the elevation (in meters) of each point where the field strength was computed. If you select the ELEV_M data field you will be able to set the elevation ranges you want to show on the map.
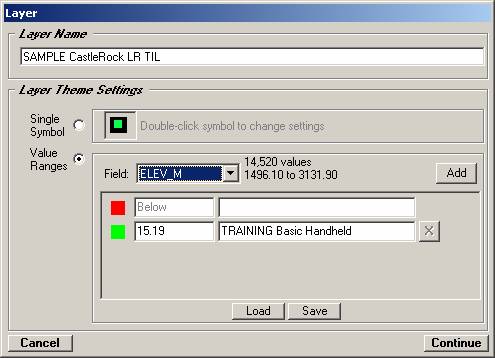
The data range values are not changed, so you need to set them manually. When you select a data field (like ELEV_M), the number of values and the range of values is shown to the right of the field name. In this example, you can set the first elevation break point to 1600 (meter), and clear out the description to the right of the value.
Note that the first level is always used as “Below…” the minimum value you set.
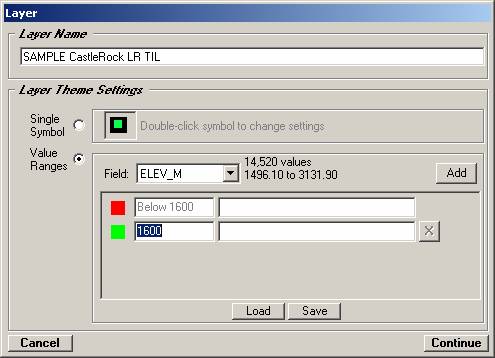
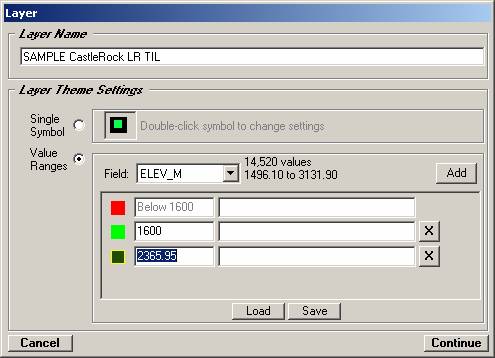
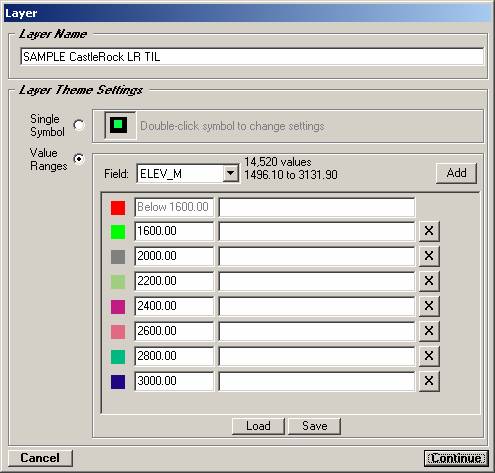
To set additional elevation break points, click the Add button:
When you click the Add button, a new level is added, and the initial value is set to halfway between the last value and the maximum value in the database range for this data field:
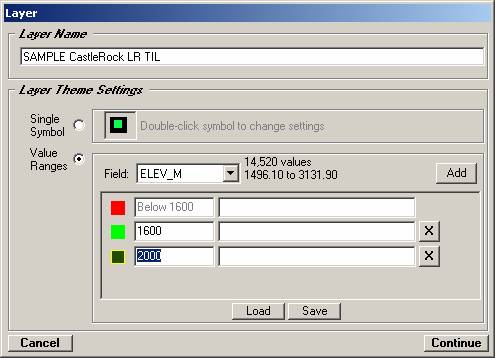
You can change the value to a value you want displayed on the map:
To change the color or fill used on the map to represent this level, double-click the color box to the left of the value:
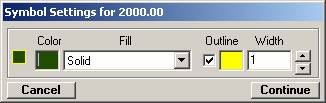
The Symbol Settings form is displayed:
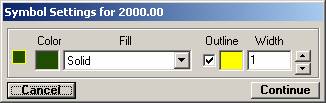
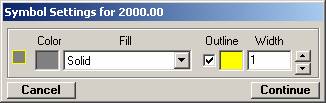
Click the Color box to select a desired color:
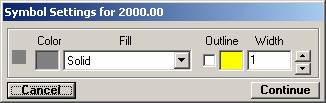
Uncheck the Outline option (if this is checked, every tile will be outlined).
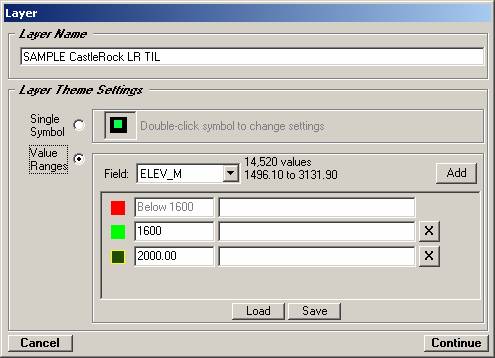
Click the Continue button to return to the Layer Properties form:
The new settings are displayed:
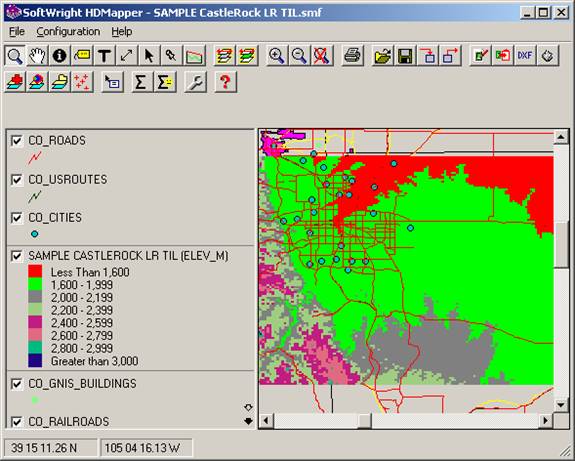
Follow the same process to add other levels you want to display. Click the Continue button to return to the HDMapper form:
Now the elevation values are displayed as the colors shown in the legend.
|
|
Copyright 2006 by SoftWright LLC