Area Coverage Performance
Q: How long does it take for TAP to run an area coverage of 1000x1000 points?
A: The time required for an Area Coverage study in TAP depends on a number of factors.
Note that all values in this example are for demonstration purposes only. You should determine appropriate settings for your application.
Naturally, any benchmarks or performance estimates are dependent on the hardware being used to run the studies in TAP. The examples in this article were computed on a 1.83GHz processor with 2Gb of memory.
When considering running area coverage studies in TAP, the flexibility provided by the program is an important factor. You can set the geographical size of the study and the amount of detail, as well as the type of study. For example, if you have several preliminary studies for different potential transmitter or repeater sites, you might choose to run initial Radial studies to get a general idea of the coverage provided by each of the sites. That will give you a quick idea of the best site to use for your application. Then you may want to run a more detailed Tile study to get the better presentation for a final report. If the target coverage is over a large area you can run a study showing the complete area, and one or more high resolution studies showing details of the coverage in areas of particular interest, such as a business district or areas of high usage. TAP enables you to customize the studies to best meet your particular needs.
The TAP Coverage Study Performance article describes several of the factors that affect the time required for area coverage studies. Several examples are included below in this article.
The processing time required for a 1000x1000 grid of computed field strength values (1,000,000 locations) depends on the geographical size of the area. Since a significant portion of the processing time is devoted to data retrieval for the paths from the base station to each of the target locations, a 1000x1000 grid in a larger area will take longer.
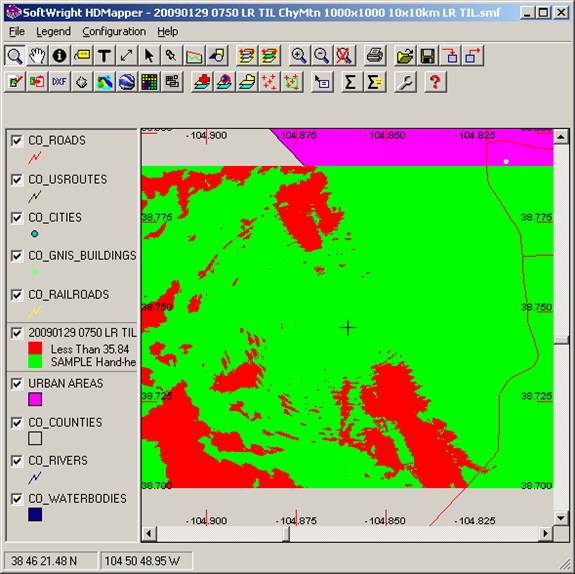
For example, a study of 1000x1000 grid points in an area 10x10km (a grid spacing of 10m) required approximately 46 minutes for 1,000,000 calculations in the relatively small area:
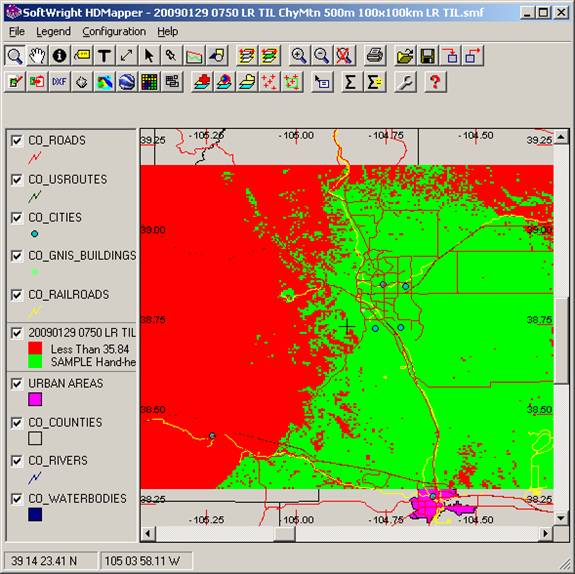
Another study, again with a 1000x1000 point grid, for an area 100x100km (a grid spacing of 100m) required just over 5 hours:

However, when setting up area coverage studies over large regions, you should consider reducing the grid interval for a tile study. In the above example, if the 100km area is printed on a standard 8-1/2 x 11 page, the interval between grid points (every 100m) will be about 0.008 inch. Depending on the resolution of the print device used, that may be more detail than the printer (or the human eye) can distinguish.
For large areas, increasing the grid interval for a tile study will result in significant speed improvements for the study with barely detectable decrease in the resolution of the finished map. For example, the same study as above, but using a grid interval of 500m (for a 200x200 grid, or 40,000 locations) produces a very similar coverage map, with a processing time of just under 12 minutes:
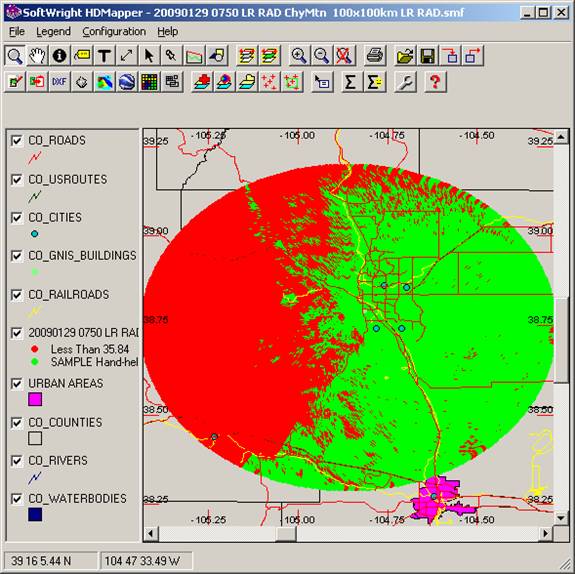
Likewise, you can also improve processing speed for a coverage over a large area by using a radial study in TAP, especially for preliminary information. You may still want to use a tile study for a final report, but the radial study can give you a general idea of the coverage. For example, 360 radials for the sample study were computed in about 2 minutes.
Because of the flexibility of TAP and the HDCoverage program used to setup area studies, you can determine the best combination of preliminary radial studies, final report tile studies, large grid interval studies over large areas, along with more detailed small grid interval studies for small areas of particular interest.
|
|
Copyright 2009 by SoftWright LLC