Composite Study Step Value
Q: Why does the map of my TAP Composite Study show horizontal and vertical lines in the coverage area?
A: The grid resolution (or “step” value) you select for a composite study needs to be appropriate for the resolution value for the component studies used for the composite.
Note that all values in this example are for demonstration purposes only. You should determine appropriate settings for your application.
A TAP Composite study uses two or more individual “component” studies, computed as Area Coverages using HDCoverage. Those component studies are combined using one of several options to compute the composite effect.
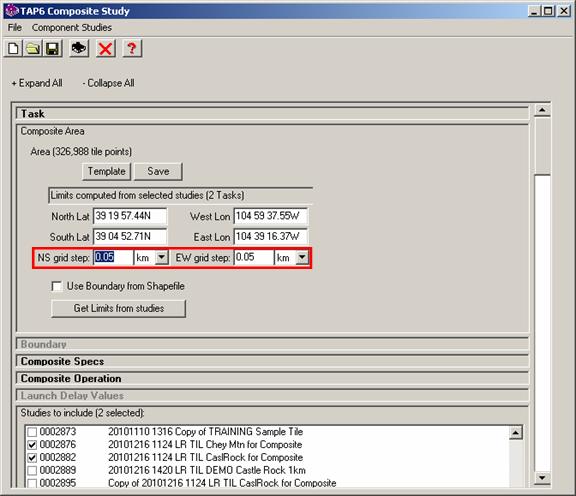
When you set up the Composite study, you define the area to be considered as well as the resolution or “step” to be used.
The “NS grid step” and “EW grid step” values define the grid of points where composite values will be computed using the field strength values computed for the component studies. (Typically the north-south grid spacing and the east-west grid spacing are the same, but you have the option of assigning different resolutions.)
The program finds the nearest computed point each composite location for each of the component studies. If the component studies are all tile studies on identical areas with identical grid step resolutions, and the Composite area is defined as the same area with the same grid step resolution, the interpolation of the component points for the Composite calculation is minimized for the most accurate results. This is typically the preferred approach. If some of the component studies included use different tile resolutions, or if they are radial studies, the Composite calculation finds the nearest point from each study at each Composite grid location. For any given component study, if there are no points computed for that component study within the Composite step distance, that component study is ignored for that Composite point.
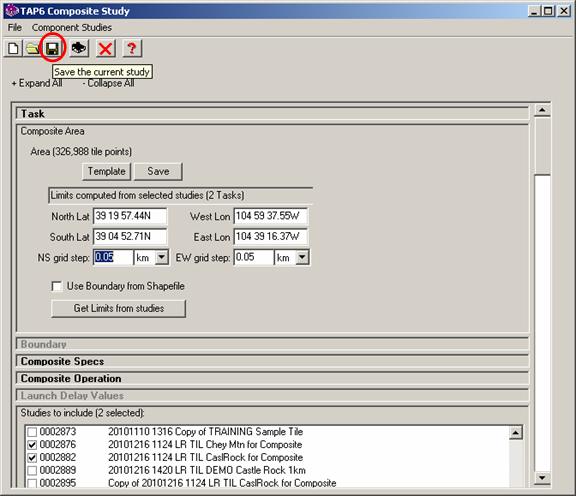
When the parameters for the Composite study have been entered, the study is saved by clicking the button on the toolbar near the top of the Composite Study form.
If the specified Composite grid step values are smaller than the component studies, a warning message is displayed.
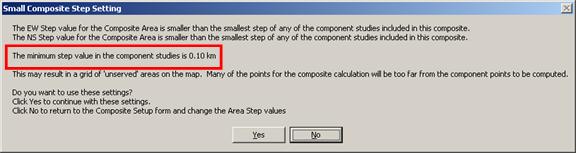
In this example, each of the selected component studies is a tile study with a grid step resolution of 0.10km, but the Composite area was set up with the grid step resolution of 0.5km. As a result, there will be many points on the Composite grid where no component points are within the grid resolution.
If the study is computed using these settings (by clicking the “Yes” button on the warning message), the result plotted in HDMapper will show the effect of the points as a grid or cross-hatch effect:
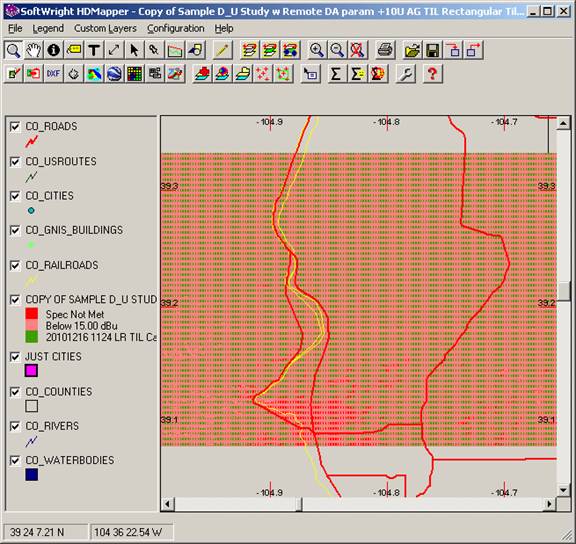
Zooming in to the map, note the green points showing where service is available, the red points where the Composite specification was not met, and the numerous pink points, labeled in the legend as below the required minimum field specified in the Composite study setup.
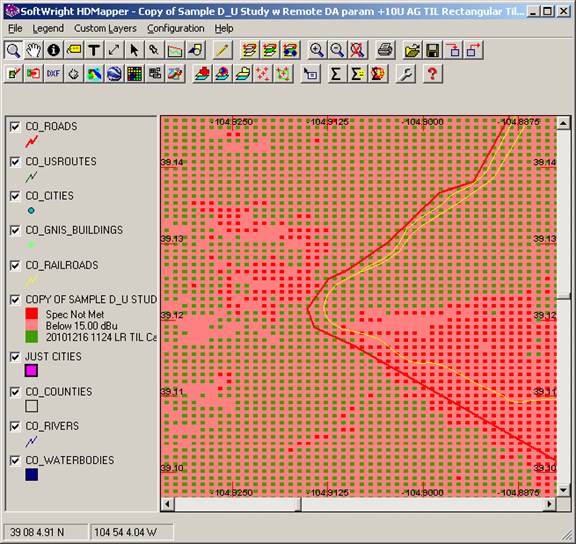
But because of the improper Composite step value, many of those “Below minimum” points are actually locations where no calculation was possible because there were no component study points near enough (within the 0.5km Composite grid resolution) to use for the calculation.
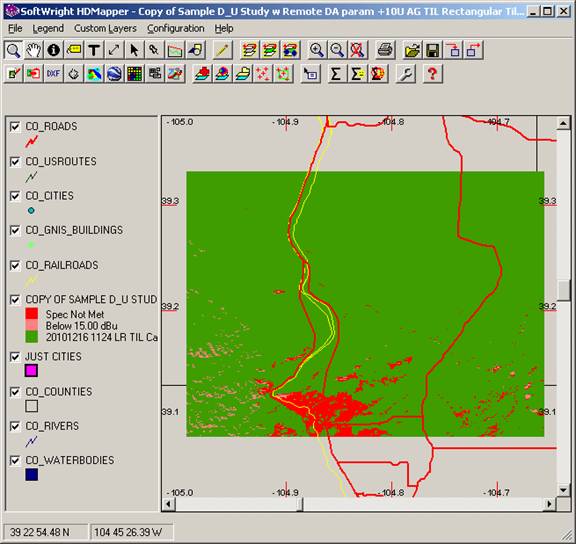
If the same Composite study is run using a Composite grid step of 0.1km (the same or greater than the component studies), the result shows the areas of adequate service, “Spec not met” as well as those areas where the component studies were computed but had inadequate field strength (the “Below…” values).
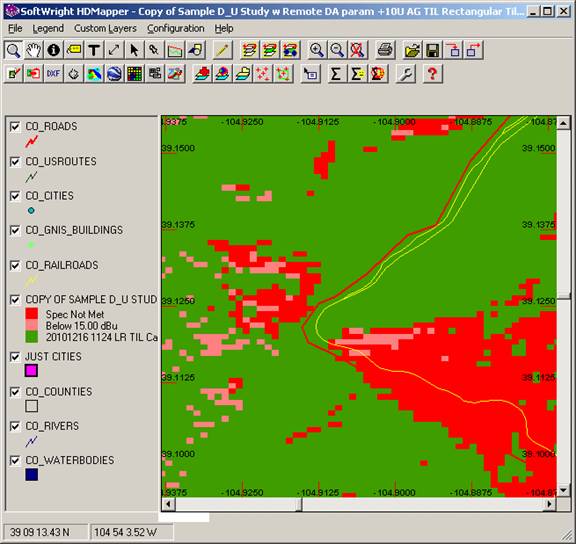
Zooming in on this study shows the actual Composite grid locations and the Composite results at those locations:
|
|
Copyright 2011 by SoftWright LLC