TAP™ includes several alternative ways to include surface features/obstructions in RF propagation studies. The preferred method may depend on the type of obstruction, such as forests or buildings. The most powerful and flexible way to include surface features is using vector (e.g., shapefile) surface features that define obstructions and can be used to calculate building wall and penetration losses in TAP path and coverage analyses.
Any vector file containing polygons can be used as a TAP surface feature obstruction. This is particularly useful in representing buildings. Simply go to the Surface Features tab of the TAP 7 Path or Coverage Study and add the surface feature file. If needed, a Calc button provides an estimate of medium building penetration loss (from TSB 88.2) as a function of frequency and reliability.
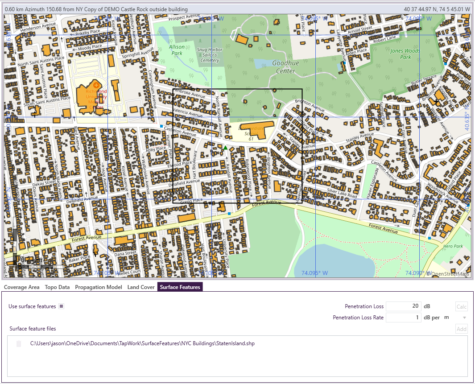
The user can set two loss parameters. The first is a constant Penetration Loss that is applied when a transmitter or a study point fall within a building (i.e., within the building footprint, with an AGL height below the building height) and the path traverses an external wall of the building; if the transmitter and study point fall in different buildings, the constant loss is applied twice. The second is a Penetration Loss Rate, expressed in dB per distance unit, that applies a loss according to the depth within the building. For example, for a Penetration Loss of 20 dB and a Penetration Loss Rate of 0.3 dB/m, if a point study point falls within a building and it is, say, 15m from the external wall, total penetration loss would be 20+(15*0.3) = 24.5 dB. All the buildings that fall between the transmitter and a study point are modeled by raising the terrain by the respective building heights; similar to the treatment of Clutter-type TAP6 surface features. The loss parameters can be set either globally, or per surface feature file, or per building (by setting fields within a shape file).
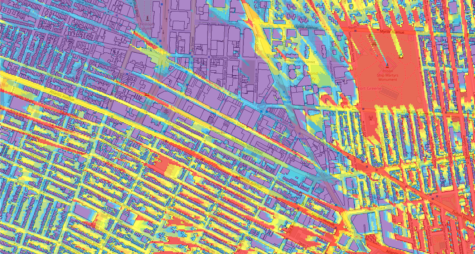
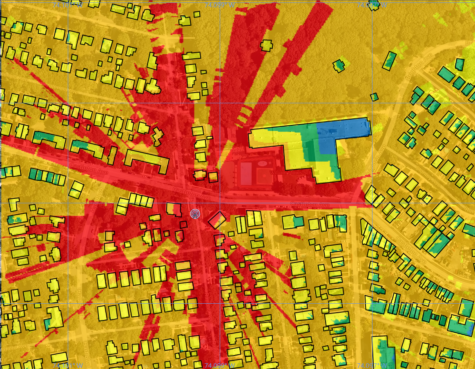
Run the coverage study and when it completes, building penetration losses will be apparent inside buildings and RF shadowing will be apparent behind buildings. Note that in the figure above, the signal fades according to the set dB/m loss inside the large building near the center of the study. The signal level is higher on the end of the building nearest to the transmitter and fades (shown in blue) on the far side of the interior of the building. In the figure below, the transmitter is at the lower right and the coverage study result shows shading due to buildings and obvious higher signal strength along unobstructed streets and in open areas.