It is common, especially for public-safety communication applications, for TAP™ users to want to compute the RF field strength coverage and coverage statistics for specific municipal areas, such as a U.S. county. Fortunately, this is straightforward in TAP™ by creating a “Bounded Tile Study”.
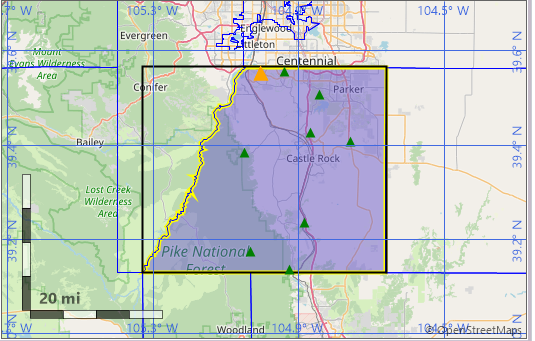
Municipal boundaries are typically available via shapefiles that may be obtain from SoftWright or other sources. The key is to create a Tile Study and the load the shapefile layer and select the active layer on the map to be the shapefile layer containing the county boundaries. Detailed instructions for how to create a Bounded Tile Study are included in the built-in TAP help files. When the bounded tile study setup is complete, the Map View will look something like the below example for Douglas County, Colorado, USA. The coverage study results will only be calculated for points inside the county boundary.
The area coverage results may be styled in a variety of ways to show coverage or different levels of service depending on the application. In the below example, the style shows where TalkBack and TalkOut coverage are provided over the bounded county area.
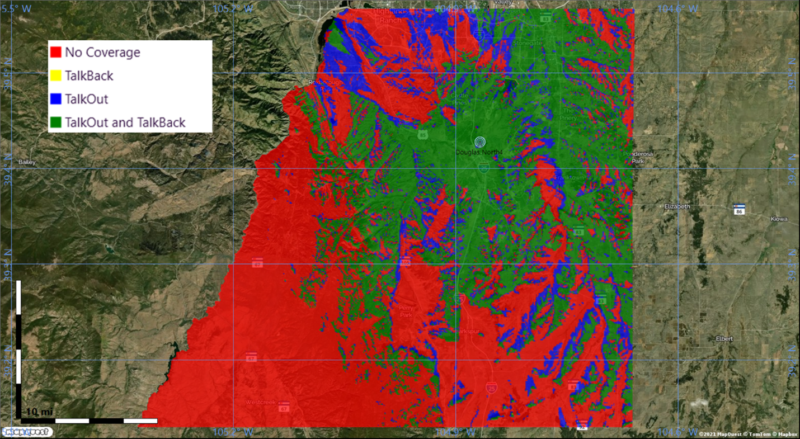
For any user-defined class-breaks, TAP generates coverage statistics, allowing the user to determine what percentage of the area is covered for different link configurations or performance levels.
